7 Emerging and Early Adulthood
Historically, early adulthood spanned from approximately 18 (the end of adolescence) until 40 to 45 (beginning of middle adulthood). More recently, developmentalists have divided this age period into two separate stages: Emerging adulthood followed by early adulthood. Although these age periods differ in their physical, cognitive, and social development, overall the age period from 18 to 45 is a time of peak physical capabilities and the emergence of more mature cognitive development, financial independence, and intimate relationships.
7.1 Emerging Adulthood
Explain emerging adulthood
Explain how emerging adulthood differs from adolescence and adulthood
Describe economic and cultural variations of emerging adulthood
Identify the markers of adulthood
Identify where emerging and early adults currently live
7.1.1 Emerging Adulthood Defined
Emerging adulthood is the period between the late teens and early twenties; ages 18-25, although some researchers have included up to age 29 in the definition (Society for the Study of Emerging Adulthood, 2016). Jeffrey Arnett (2000) argues that emerging adulthood is neither adolescence nor is it young adulthood. Individuals in this age period have left behind the relative dependency of childhood and adolescence but have not yet taken on the responsibilities of adulthood. “Emerging adulthood is a time of life when many different directions remain possible, when little about the future is decided for certain, when the scope of independent exploration of life’s possibilities is greater for most people than it will be at any other period of the life course” (Arnett, 2000, p. 469). Arnett identified five characteristics of emerging adulthood that distinguished it from adolescence and young adulthood (Arnett, 2006).
It is the age of identity exploration. In 1950, Erik Erikson proposed that it was during adolescence that humans wrestled with the question of identity. Yet, even Erikson (1968) commented on a trend during the 20th century of a “prolonged adolescence” in industrialized societies. Today, most identity development occurs during the late teens and early twenties rather than adolescence. It is during emerging adulthood that people are exploring their career choices and ideas about intimate relationships, setting the foundation for adulthood.
Arnett also described this time period as the age of instability (Arnett, 2000; Arnett, 2006). Exploration generates uncertainty and instability. Emerging adults change jobs, relationships, and residences more frequently than other age groups.
This is also the age of self-focus. Being self-focused is not the same as being “self-centered.” Adolescents are more self-centered than emerging adults. Arnett reports that in his research, he found emerging adults to be very considerate of the feelings of others, especially their parents. They now begin to see their parents as people not just parents, something most adolescents fail to do (Arnett, 2006). Nonetheless, emerging adults focus more on themselves, as they realize that they have few obligations to others and that this is the time where they can do what they want with their life.
This is also the age of feeling in-between. When asked if they feel like adults, more 18 to 25 year-olds answer “yes and no” than do teens or adults over the age of 25 (Arnett, 2001). Most emerging adults have gone through the changes of puberty, are typically no longer in high school, and many have also moved out of their parents’ home. Thus, they no longer feel as dependent as they did as teenagers. Yet, they may still be financially dependent on their parents to some degree, and they have not completely attained some of the indicators of adulthood, such as finishing their education, obtaining a good full-time job, being in a committed relationship, or being responsible for others. It is not surprising that Arnett found that 60% of 18 to 25 year-olds felt that in some ways they were adults, but in some ways, they were not (Arnett, 2001).
Emerging adulthood is the age of possibilities. It is a time period of optimism as more 18 to 25 year-olds feel that they will someday get to where they want to be in life. Arnett (2000, 2006) suggests that this optimism is because these dreams have yet to be tested. For example, it is easier to believe that you will eventually find your soul mate when you have yet to have had a serious relationship. It may also be a chance to change directions, for those whose lives up to this point have been difficult. The experiences of children and teens are influenced by the choices and decisions of their parents. If the parents are dysfunctional, there is little a child can do about it. In emerging adulthood, people can move out and move on. They have the chance to transform their lives and move away from unhealthy environments. Even those whose lives were happier and more fulfilling as children, now have the opportunity in emerging adulthood to become independent and make decisions about the direction they would like their life to take.
Socioeconomic Class and Emerging Adulthood: The theory of emerging adulthood was initially criticized as only reflecting upper middle-class, college-attending young adults in the United States and not those who were working class or poor (Arnett, 2016). Consequently, Arnett reviewed results from the 2012 Clark University Poll of Emerging Adults, whose participants were demographically similar to the United States population. Results primarily indicated consistencies across aspects of the theory, including positive and negative perceptions of the time-period and views on education, work, love, sex, and marriage. Two significant differences were found, the first being that emerging adults from lower socioeconomic classes identified more negativity in their emotional lives, including higher levels of depression. Secondly, those in the lowest socioeconomic group were more likely to agree that they had not been able to find sufficient financial support to obtain the education they believed they needed. Overall, Arnett concluded that emerging adulthood exists wherever there is a period between the end of adolescence and entry into adult roles, but acknowledging social, cultural, and historical contexts was also important.
7.1.2 Cultural Variations
The five features proposed in the theory of emerging adulthood originally were based on research involving about Americans between ages 18 and 29 from various ethnic groups, social classes, and geographical regions (Arnett, 2004, 2016). To what extent does the theory of emerging adulthood apply internationally?
The answer to this question depends greatly on what part of the world is considered. Demographers make a useful distinction between the developing countries that comprise the majority of the world’s population and the economically developed countries that are part of the Organization for Economic Co-operation and Development (OECD), including the United States, Canada, Western Europe, Japan, South Korea, Australia, and New Zealand. The current population of OECD countries (also called developed countries) is 1.2 billion, about 18% of the total world population (United Nations Development Programme, 2011). The rest of the human population resides in developing countries, which have much lower median incomes, much lower median educational attainment, and much higher incidence of illness, disease, and early death. Let us consider emerging adulthood in other OECD countries as little is known about the experiences of 18-25 year-olds in developing countries.
The same demographic changes as described above for the United States have taken place in other OECD countries as well. This is true of participation in postsecondary education, as well as median ages for entering marriage and parenthood (UNdata, 2010). However, there is also substantial variability in how emerging adulthood is experienced across OECD countries. Europe is the region where emerging adulthood is longest and most leisurely. The median ages for entering marriage and parenthood are near 30 in most European countries (Douglass, 2007). Europe today is the location of the most affluent, generous, and egalitarian societies in the world, in fact, in human history (Arnett, 2007). Governments pay for tertiary education, assist young people in finding jobs, and provide generous unemployment benefits for those who cannot find work. In northern Europe, many governments also provide housing support. Emerging adults in European societies make the most of these advantages, gradually making their way to adulthood during their twenties while enjoying travel and leisure with friends.
The lives of Asian emerging adults in developed countries, such as Japan and South Korea, are in some ways similar to the lives of emerging adults in Europe and in some ways strikingly different. Like European emerging adults, Asian emerging adults tend to enter marriage and parenthood around age 30 (Arnett, 2011). Like European emerging adults, Asian emerging adults in Japan and South Korea enjoy the benefits of living in affluent societies with generous social welfare systems that provide support for them in making the transition to adulthood, including free university education and substantial unemployment benefits.
However, in other ways, the experience of emerging adulthood in Asian OECD countries is markedly different than in Europe. Europe has a long history of individualism, and today’s emerging adults carry that legacy with them in their focus on self-development and leisure during emerging adulthood. In contrast, Asian cultures have a shared cultural history emphasizing collectivism and family obligations.
Although Asian cultures have become more individualistic in recent decades, as a consequence of globalization, the legacy of collectivism persists in the lives of emerging adults. They pursue identity explorations and self-development during emerging adulthood, like their American and European counterparts, but within narrower boundaries set by their sense of obligations to others, especially their parents (Phinney & Baldelomar, 2011). For example, in their views of the most important criteria for becoming an adult, emerging adults in the United States and Europe consistently rank financial independence among the most important markers of adulthood. In contrast, emerging adults with an Asian cultural background especially emphasize becoming capable of supporting parents financially as among the most important criteria (Arnett, 2003; Nelson, Badger, & Wu, 2004). This sense of family obligation may curtail their identity explorations in emerging adulthood to some extent, as they pay more heed to their parents’ wishes about what they should study, what job they should take, and where they should live than emerging adults do in the West (Rosenberger, 2007).
Is your culture one that promotes romantic relationships for emerging adults? Or does it encourage you to wait till you’re older? What would it be like to live in the opposite culture?
7.1.3 When Does Adulthood Begin?
According to Rankin and Kenyon (2008), historically the process of becoming an adult was more clearly marked by rites of passage. For many, marriage and parenthood were considered entry into adulthood. However, these role transitions are no longer considered the important markers of adulthood (Arnett, 2001). Economic and social changes have resulted in more young adults attending college (Rankin & Kenyon, 2008) and a delay in marriage and having children (Arnett & Taber, 1994; Laursen & Jensen-Campbell, 1999) Consequently, current research has found financial independence and accepting responsibility for oneself to be the most important markers of adulthood in Western culture across age (Arnett, 2001) and ethnic groups (Arnett, 2004).
In looking at college students’ perceptions of adulthood, Rankin and Kenyon (2008) found that some students still view rites of passage as important markers. College students who had placed more importance on role transition markers, such as parenthood and marriage, belonged to a fraternity/sorority, were traditionally aged (18–25), belonged to an ethnic minority, were of a traditional marital status; i.e., not cohabitating, or belonged to a religious organization, particularly for men. These findings supported the view that people holding collectivist or more traditional values place more importance on role transitions as markers of adulthood. In contrast, older college students and those cohabitating did not value role transitions as markers of adulthood as strongly.
7.1.4 Young Adults Living Arrangements
In 2014, for the first time in more than 130 years, adults 18 to 34 were more likely to be living in their parents’ home than they were to be living with a spouse or partner in their own household (Fry, 2016). The current trend is that young Americans are not choosing to settle down romantically before age 35. Since 1880, living with a romantic partner was the most common living arrangement among young adults. In 1960, 62% of America’s 18- to 34-year-olds were living with a spouse or partner in their own household, while only 20% were living with their parents.
By 2014, 31.6% of early adults were living with a spouse or partner in their own household, while 32.1% were living in the home of their parent(s). Another 14% of early adults lived alone, were a single parent, or lived with one or more roommates. The remaining 22% lived in the home of another family member (such as a grandparent, in-law, or sibling), a non-relative, or in group quarters (e.g., college dormitories). Comparing ethnic groups, 36% of black and Hispanic early adults lived at home, while 30% of white young adults lived at home.
As can be seen in Figure 7.5, gender differences in living arrangements are also noted in that young men were living with parents at a higher rate than young women. In 2014, 35% of young me were residing with their parents, while 28% were living with a spouse or partner in their own household. Young women were more likely to be living with a spouse or partner (35%) than living with their parents (29%). Additionally, more young women (16%) than young men (13%) were heading up a household without a spouse or partner, primarily because women are more likely to be single parents living with their children. Lastly, young men (25%) were more likely than young women (19%) to be living in the home of another family member, a non-relative, or in some type of group quarters (Fry, 2016).
What are some factors that help explain these changes in living arrangements? First, early adults are postponing marriage or choosing not to marry or cohabitate. Lack of employment and lower wages have especially contributed to males residing with their parents. Men who are employed are less likely to live at home. Wages for young men (adjusting for inflation) have been falling since 1970 and correlate with the rise in young men living with their parents. The recent recession and recovery (2007-present) has also contributed to the increase in early adults living at home. College enrollments increased during the recession, which further increased early adults living at home. However, once early adults possess a college degree, they are more likely to establish their own households (Fry, 2016).
7.2 Physical Development in Emerging and Early Adulthood
Summarize the overall physical growth in early adulthood
Describe statistics, possible causes, and consequences of obesity
Explain how early adulthood is a healthy, yet risky time of life
Identify the risk factors for substance use
Describe the changes in brain maturation
Describe gender in adulthood, including gender minorities and stress
Define sexuality and explain the female and male reproductive systems
Describe the brain areas and hormones responsible for sexual behavior
Identify sexually transmitted infections
Describe cultural views related to sexuality
Describe research on sexual orientation
7.2.1 The Physiological Peak
People in their mid-twenties to mid-forties are considered to be in early adulthood. By the time we reach early adulthood, our physical maturation is complete, although our height and weight may increase slightly. Those in their early twenties are probably at the peak of their physiological development, including muscle strength, reaction time, sensory abilities, and cardiac functioning. The reproductive system, motor skills, strength, and lung capacity are all operating at their best. Most professional athletes are at the top of their game during this stage, and many women have children in the early-adulthood years (Boundless, 2016).
The aging process actually begins during early adulthood. Around the age of 30, many changes begin to occur in different parts of the body. For example, the lens of the eye starts to stiffen and thicken, resulting in changes in vision (usually affecting the ability to focus on close objects). Sensitivity to sound decreases; this happens twice as quickly for men as for women. Hair can start to thin and become gray around the age of 35, although this may happen earlier for some individuals and later for others. The skin becomes drier and wrinkles start to appear by the end of early adulthood. This includes a decline in response time and the ability to recover quickly from physical exertion. The immune system also becomes less adept at fighting off illness, and reproductive capacity starts to decline (Boundless, 2016).
7.2.2 Obesity
Although at the peak of physical health, a concern for early adults is the current rate of obesity. Results from the National Center for Health Statistics indicated that an estimated 70.7% of U.S. adults aged 20 and over were overweight in 2012 (CDC, 2015b) and by 2016, 39.8% were considered obese (Hales, Carroll, Fryar, & Ogden, 2017)). Body mass index (BMI), expressed as weight in kilograms divided by height in meters squared (kg/m2), is commonly used to classify overweight (BMI 25.0–29.9), obesity (BMI greater than or equal to 30.0), and extreme obesity (BMI greater than or equal to 40.0). The current statistics are an increase from the 2013-2014 statistics that indicated that an estimated 35.1% were obese, and 6.4% extremely obese (Fryar, Carroll, & Ogden, 2014). The CDC also indicated that one’s 20s are the prime time to gain weight as the average person gains one to two pounds per year from early adulthood into middle adulthood. The average man in his 20s weighs around 185 pounds and by his 30s weighs approximately 200 pounds. The average American woman weighs 162 pounds in her 20s and 170 pounds in her 30s.
The American obesity crisis is also reflected worldwide (Wighton, 2016). In 2014, global obesity rates for men were measured at 10.8% and among women 14.9%. This translates to 266 million obese men and 375 million obese women in the world, and more people were identified as obese than underweight. Although obesity is seen throughout the world, more obese men and women live in China and the USA than in any other country. Figure 7.6 illustrates how waist circumference is also used as a measure of obesity. Figure 7.7 demonstrates the percentage growth for youth (2-19 years) and adults (20-60+ years) identified as obese between 1999 and 2016.

Causes of Obesity: According to the Centers for Disease Control and Prevention (CDC) (2016), obesity originates from a complex set of contributing factors, including one’s environment, behavior, and genetics. Societal factors include culture, education, food marketing and promotion, the quality of food, and the physical activity environment available. Behaviors leading to obesity include diet, the amount of physical activity, and medication use. Lastly, there does not appear to be a single gene responsible for obesity. Rather, research has identified variants in several genes that may contribute to obesity by increasing hunger and food intake. Another genetic explanation is the mismatch between today’s environment and “energy-thrifty genes” that multiplied in the distant past, when food sources were unpredictable. The genes that helped our ancestors survive occasional famines are now being challenged by environments in which food is plentiful all the time. Overall, obesity most likely results from complex interactions among the environment and multiple genes.
Obesity Health Consequences: Obesity is considered to be one of the leading causes of death in the United States and worldwide. Additionally, the medical care costs of obesity in the United States were estimated to be $147 billion in 2008. According to the CDC (2016) compared to those with a normal or healthy weight, people who are obese are at increased risk for many serious diseases and health conditions including:
All-causes of death (mortality)
High blood pressure (Hypertension)
High LDL cholesterol, low HDL cholesterol, or high levels of triglycerides (Dyslipidemia)
Type 2 diabetes
Coronary heart disease
Stroke
Gallbladder disease
Osteoarthritis (a breakdown of cartilage and bone within a joint)
Sleep apnea and breathing problems
Some cancers (endometrial, breast, colon, kidney, gallbladder, and liver)
Low quality of life
Mental illness, such as clinical depression, anxiety, and other mental disorders
Body pain and difficulty with physical functioning
7.2.3 A Healthy, But Risky Time
Doctor’s visits are less frequent in early adulthood than for those in midlife and late adulthood and are necessitated primarily by injury and pregnancy (Berger, 2005). However, the top five causes of death in emerging and early adulthood are non-intentional injury (including motor vehicle accidents), homicide, and suicide with cancer and heart disease completing the list (Heron, & Smith, 2007). Rates of violent death (homicide, suicide, and accidents) are highest among young adult males, and vary by race and ethnicity. Rates of violent death are higher in the United States than in Canada, Mexico, Japan, and other selected countries. Males are 3 times more likely to die in auto accidents than are females (Frieden, 2011).
Alcohol Abuse: A significant contributing factor to risky behavior is alcohol. According to the 2014 National Survey on Drug Use and Health (National Institute on Alcohol Abuse and Alcoholism (NIAAA), 2016) 88% of people ages 18 or older reported that they drank alcohol at some point in their lifetime; 71% reported that they drank in the past year; and 57% reported drinking in the past month. Additionally, 6.7% reported that they engaged in heavy drinking in the past month. Heavy drinking is defined as drinking five or more drinks on the same occasion on each of five or more days in the past 30 days. Nearly 88,000 people (approximately 62,000 men and 26,000 women) die from alcohol-related causes annually, making it the fourth leading preventable cause of death in the United States. In 2014, alcohol-impaired driving fatalities accounted for 9,967 deaths (31% of overall driving fatalities).
The NIAAA defines binge drinking when blood alcohol concentration levels reach 0.08 g/dL. This typically occurs after four drinks for women and five drinks for men in approximately two hours. In 2014, 25% of people ages 18 or older reported that they engaged in binge drinking in the past month. According to the NIAAA (2015) “Binge drinking poses serious health and safety risks, including car crashes, drunk-driving arrests, sexual assaults, and injuries. Over the long term, frequent binge drinking can damage the liver and other organs,” (p. 1).
Alcohol and College Students: Results from the 2014 survey demonstrated a difference between the amount of alcohol consumed by college students and those of the same age who are not in college (NIAAA, 2016). Specifically, 60% of full-time college students’ ages 18–22 drank alcohol in the past month compared with 51.5% of other persons of the same age not in college. In addition, 38% of college students’ ages 18–22 engaged in binge drinking; that is, five or more drinks on one occasion in the past month, compared with 33.5% of other persons of the same age. Lastly, 12% of college students’ (ages 18–22) engaged in heavy drinking; that is, binge drinking on five or more occasions per month, in the past month. This compares with 9.5% of other emerging adults not in college.
The consequences for college drinking are staggering, and the NIAAA (2016) estimates that each year the following occur:
1,825 college students between the ages of 18 and 24 die from alcohol-related unintentional injuries, including motor-vehicle crashes.
696,000 students between the ages of 18 and 24 are assaulted by another student who has been drinking.
Roughly 1 in 5 college students meet the criteria for an Alcohol Use Disorder.
About 1 in 4 college students report academic consequences from drinking, including missing class, falling behind in class, doing poorly on exams or papers, and receiving lower grades overall. (p. 1)
97,000 students between the ages of 18 and 24 report experiencing alcohol-related sexual assault or date rape.
The role alcohol plays in predicting acquaintance rape on college campuses is of particular concern. “Alcohol use in one the strongest predictors of rape and sexual assault on college campuses,” (Carroll, 2016, p. 454). Krebs, Lindquist, Warner, Fisher and Martin (2009) found that over 80% of sexual assaults on college campuses involved alcohol. Being intoxicated increases a female’s risk of being the victim of date or acquaintance rape (Carroll, 2007). Females are more likely to blame themselves and to be blamed by others if they were intoxicated when raped. College students view perpetrators who were drinking as less responsible, and victims who were drinking as more responsible for the assaults (Untied, Orchowski, Mastroleo, & Gidycz, 2012).
Factors Affecting College Students’ Drinking: Several factors associated with college life affect a student’s involvement with alcohol (NIAAA, 2015). These include the pervasive availability of alcohol, inconsistent enforcement of underage drinking laws, unstructured time, coping with stressors, and limited interactions with parents and other adults. Due to social pressures to conform and expectations when entering college, the first six weeks of freshman year are an especially susceptible time for students. Additionally, more drinking occurs in colleges with active Greek systems and athletic programs. Alcohol consumption is lowest among students living with their families and commuting, while it is highest among those living in fraternities and sororities.
College Strategies to Curb Drinking: Strategies to address college drinking involve the individual-level and campus community as a whole. Identifying at-risk groups, such as first year students, members of fraternities and sororities, and athletes has proven helpful in changing students’ knowledge, attitudes, and behavior regarding alcohol (NIAAA, 2015). Interventions include education and awareness programs, as well as intervention by health professionals. At the college-level, reducing the availability of alcohol has proven effective by decreasing both consumption and negative consequences.
Non-Alcohol Substance Use: Illicit drug use peaks between the ages of 19 and 22 and then begins to decline. Additionally, 25% of those who smoke cigarettes, 33% of those who smoke marijuana, and 70% of those who abuse cocaine began using after age 17 (Volkow, 2004). Emerging adults (18 to 25) are the largest abusers of prescription opioid pain relievers, anti-anxiety medications, and Attention Deficit Hyperactivity Disorder medication (National Institute on Drug Abuse, 2015). In 2016, opioid misuse within the past 12 months was reported by 3.6% of 12-17 year-olds and was twice as high among those 18-25 (Office of Adolescent Health, 2019). In 2014 more than 1700 emerging adults died from a prescription drug overdose. This is an increase of four times since 1999. Additionally, for every death there were 119 emergency room visits.
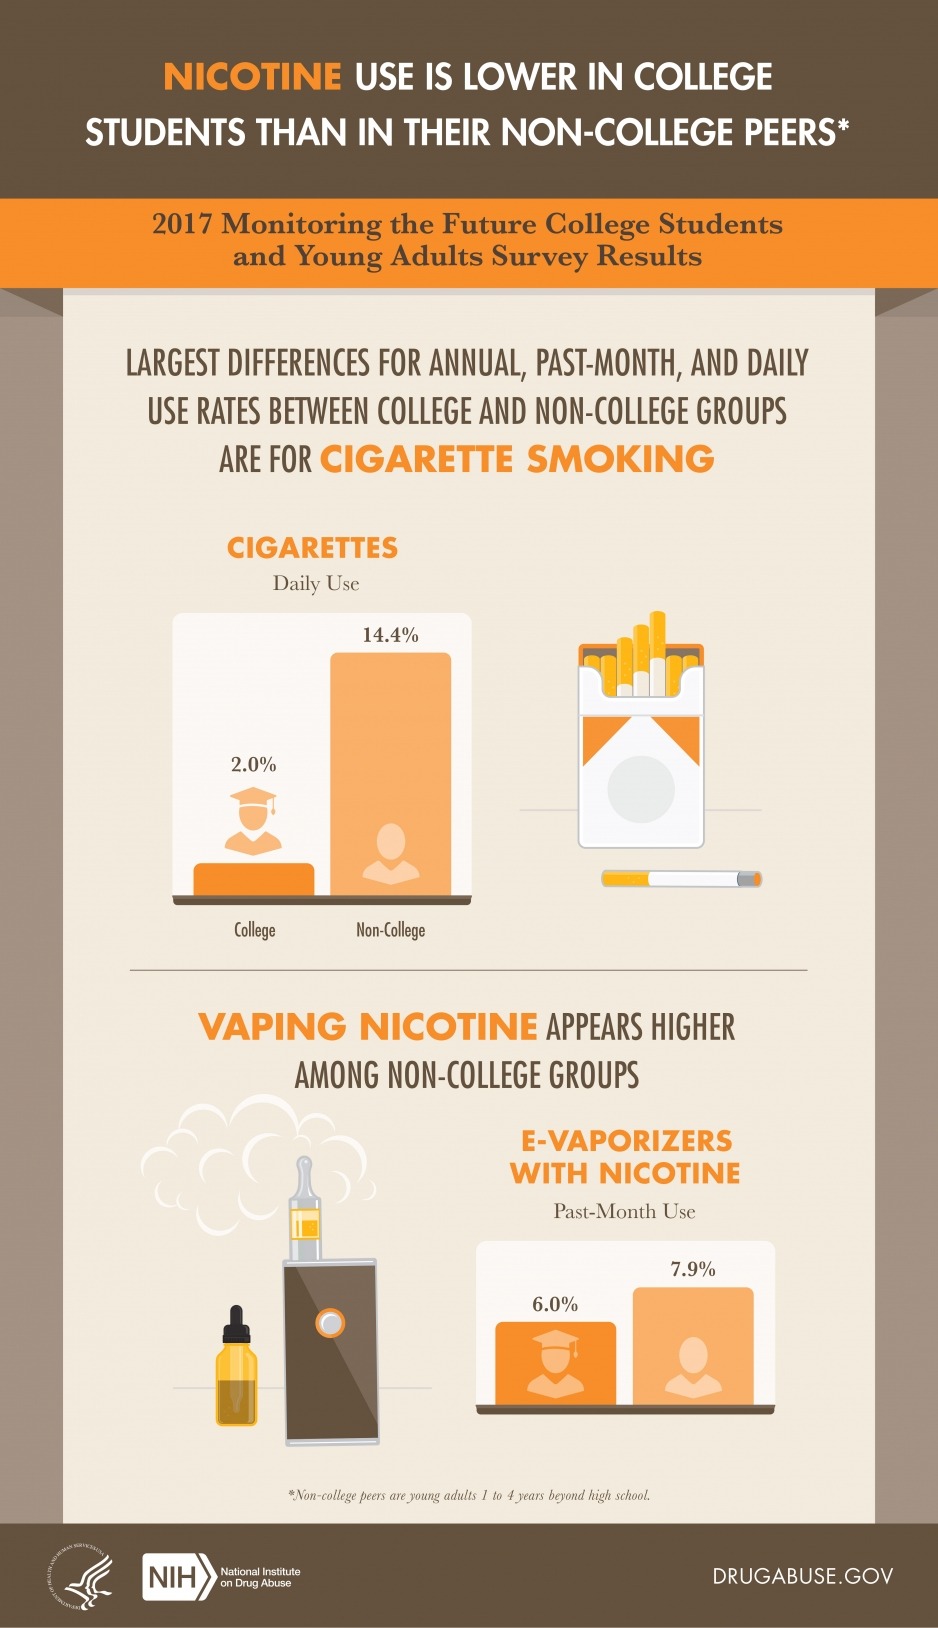
Daily marijuana use is at the highest level in three decades (National Institute on Drug Abuse, 2015). For those in college, 2014 data indicate that 6% of college students smoke marijuana daily, while only 2% smoked daily in 1994. For noncollege students of the same age, the daily percentage is twice as high (approximately 12%). Additionally, according to a recent survey by the National Institute of Drug Abuse (2018), daily cigarette smoking is lower for those in college in comparison to non-college groups (see Figure 7.10).
Rates of violent death are influenced by substance use which peaks during emerging and early adulthood. Drugs impair judgment, reduce inhibitions, and alter mood, all of which can lead to dangerous behavior. Reckless driving, violent altercations, and forced sexual encounters are some examples. Drug and alcohol use increase the risk of sexually transmitted infections because people are more likely to engage in risky sexual behavior when under the influence. This includes having sex with someone who has had multiple partners, having anal sex without the use of a condom, having multiple partners, or having sex with someone whose history is unknown. Lastly, as previously discussed, drugs and alcohol ingested during pregnancy have a teratogenic effect on the developing embryo and fetus.
7.2.4 Gender
As previously discussed in chapter 4, gender is the cultural, social and psychological meanings associated with masculinity and feminity. A person’s sense of self as a member of a particular gender is known as gender identity. Because gender is considered a social construct, meaning that it does not exist naturally, but is instead a concept that is created by cultural and societal norms, there are cultural variations on how people express their gender identity. For example, in American culture, it is considered feminine to wear a dress or skirt. However, in many Middle Eastern, Asian, and African cultures, dresses or skirts (often referred to as sarongs, robes, or gowns) can be considered masculine. Similarly, the kilt worn by a Scottish male does not make him appear feminine in his culture.
For many adults, the drive to adhere to masculine and feminine gender roles, or the societal expectations associated with being male or female, continues throughout life. In American culture, masculine roles have traditionally been associated with strength, aggression, and dominance, while feminine roles have traditionally been associated with passivity, nurturing, and subordination. Men tend to outnumber women in professions such as law enforcement, the military, and politics, while women tend to outnumber men in care-related occupations such as childcare, healthcare, and social work. These occupational roles are examples of stereotypical American male and female behavior, derived not from biology or genetics, but from our culture’s traditions. Adherence to these roles may demonstrate fulfillment of social expectations, however, not necessarily personal preferences (Diamond, 2002).
Consequently, many adults are challenging gender labels and roles, and the long-standing gender binary; that is, categorinzing humans as only female and male, has been undermined by current psychological research (Hyde, Bigler, Joel, Tate, & van Anders, 2019). The term gender now encompasses a wide range of possible identities, including cisgender, transgender, agender, genderfluid, genderqueer, gender nonconforming, bigender, pangender, ambigender, non-gendered, intergender, and Two-spirit which is a modern umbrella term used by some indigenous North Americans to describe gender-variant individuals in their communities (Carroll, 2016). Hyde et al. (2019) advocates for a conception of gender that stresses multiplicity and diversity and uses multiple categories that are not mutually exclusive.
Gender Minority Discrimination: Gender nonconforming people are much more likely to experience harassment, bullying, and violence based on their gender identity; they also experience much higher rates of discrimination in housing, employment, healthcare, and education (Borgogna, McDermott, Aita, & Kridel, 2019; National Center for Transgender Equality, 2015). Transgender individuals of color face additional financial, social, and interpersonal challenges, in comparison to the transgender community as a whole, as a result of structural racism. Black transgender people reported the highest level of discrimination among all transgender individuals of color. As members of several intersecting minority groups, transgender people of color, and transgender women of color in particular, are especially vulnerable to employment discrimination, poor health outcomes, harassment, and violence. Consequently, they face even greater obstacles than white transgender individuals and cisgender members of their own race.
![]()
Gender Minority Status and Mental Health: Using data from over 43,000 college students, Borgona et al. (2019) examined mental health differences among several gender groups, including those identifying as cisgender, transgender and gender nonconforming. Results indicated that participants who identified as transgender and gender nonconforming had significantly higher levels of anxiety and depression than those identifying as cisgender. Bargona et al. explained the higher rates of anxiety and depression using the minority stress model, which states that an unaccepting social environment results in both external and internal stress which contributes to poorer mental health. External stressors include discrimination, harassment, and prejudice, while internal stressors include negative thoughts, feelings and emotions resulting from one’s identity. Borgona et al. recommends that mental health services that are sensitive to both gender minority and sexual minority statatus be available.
![]()
The transgender children discussed in chapter 4 may, when they become an adult, alter their bodies through medical interventions, such as surgery and hormonal therapy, so that their physical being is better aligned with gender identity. However, not all transgender individuals choose to alter their bodies or physically transition. Many will maintain their original anatomy but may present themselves to society as a different gender, often by adopting the dress, hairstyle, mannerisms, or other characteristics typically assigned to a certain gender. It is important to note that people who cross-dress, or wear clothing that is traditionally assigned to the opposite gender, such as transvestites, drag kings, and drag queens, do not necessarily identify as transgender (though some do). People often confuse the term transvestite, which is the practice of dressing and acting in a style or manner traditionally associated with another sex (APA, 2013) with transgender. Cross-dressing is typically a form of self-expression, entertainment, or personal style, and not necessarily an expression about one’s gender identity.
7.2.5 Sexuality
Human sexuality refers to people’s sexual interest in and attraction to others, as well as their capacity to have erotic experiences and responses. Sexuality may be experienced and expressed in a variety of ways, including thoughts, fantasies, desires, beliefs, attitudes, values, behaviors, practices, roles, and relationships. These may manifest themselves in biological, physical, emotional, social, or spiritual aspects. The biological and physical aspects of sexuality largely concern the human reproductive functions, including the human sexual-response cycle and the basic biological drive that exists in all species. Emotional aspects of sexuality include bonds between individuals that are expressed through profound feelings or physical manifestations of love, trust, and care. Social aspects deal with the effects of human society on one’s sexuality, while spirituality concerns an individual’s spiritual connection with others through sexuality. Sexuality also impacts, and is impacted by cultural, political, legal, philosophical, moral, ethical, and religious aspects of life.
The Sexual Response Cycle: Sexual motivation, often referred to as libido, is a person’s overall sexual drive or desire for sexual activity. This motivation is determined by biological, psychological, and social factors. In most mammalian species, sex hormones control the ability to engage in sexual behaviors. However, sex hormones do not directly regulate the ability to copulate in primates (including humans); rather, they are only one influence on the motivation to engage in sexual behaviors. Social factors, such as work and family, also have an impact, as do internal psychological factors like personality and stress. Sex drive may also be affected by hormones, medical conditions, medications, lifestyle stress, pregnancy, and relationship issues.
The sexual response cycle is a model that describes the physiological responses that take place during sexual activity. According to Kinsey, Pomeroy, and Martin (1948), the cycle consists of four phases: excitement, plateau, orgasm, and resolution. The excitement phase is the phase in which the intrinsic (inner) motivation to pursue sex arises. The plateau phase is the period of sexual excitement with increased heart rate and circulation that sets the stage for orgasm. Orgasm is the release of tension, and the resolution period is the unaroused state before the cycle begins again.
The Brain and Sex: The brain is the structure that translates the nerve impulses from the skin into pleasurable sensations. It controls nerves and muscles used during sexual behavior. The brain regulates the release of hormones, which are believed to be the physiological origin of sexual desire. The cerebral cortex, which is the outer layer of the brain that allows for thinking and reasoning, is believed to be the origin of sexual thoughts and fantasies. Beneath the cortex is the limbic system, which consists of the amygdala, hippocampus, cingulate gyrus, and septal area. These structures are where emotions and feelings are believed to originate, and they are important for sexual behavior.
The hypothalamus is the most important part of the brain for sexual functioning. This is the small area at the base of the brain consisting of several groups of nerve-cell bodies that receives input from the limbic system. Studies with lab animals have shown that destruction of certain areas of the hypothalamus causes complete elimination of sexual behavior. One of the reasons for the importance of the hypothalamus is that it controls the pituitary gland, which secretes hormones that control the other glands of the body.

Hormones: Several important sexual hormones are secreted by the pituitary gland. Oxytocin, also known as the hormone of love, is released during sexual intercourse when an orgasm is achieved. Oxytocin is also released in females when they give birth or are breast feeding; it is believed that oxytocin is involved with maintaining close relationships. Both prolactin and oxytocin stimulate milk production in females. Follicle-stimulating hormone (FSH) is responsible for ovulation in females by triggering egg maturity; it also stimulates sperm production in males. Luteinizing hormone (LH) triggers the release of a mature egg in females during the process of ovulation.
In males, testosterone appears to be a major contributing factor to sexual motivation. Vasopressin is involved in the male arousal phase, and the increase of vasopressin during erectile response may be directly associated with increased motivation to engage in sexual behavior.
The relationship between hormones and female sexual motivation is not as well understood, largely due to the overemphasis on male sexuality in Western research. Estrogen and progesterone typically regulate motivation to engage in sexual behavior for females, with estrogen increasing motivation and progesterone decreasing it. The levels of these hormones rise and fall throughout a woman’s menstrual cycle. Research suggests that testosterone, oxytocin, and vasopressin are also implicated in female sexual motivation in similar ways as they are in males, but more research is needed to understand these relationships.
Sexual Responsiveness Peak: Men and women tend to reach their peak of sexual responsiveness at different ages. For men, sexual responsiveness tends to peak in the late teens and early twenties. Sexual arousal can easily occur in response to physical stimulation or fantasizing. Sexual responsiveness begins a slow decline in the late twenties and into the thirties, although a man may continue to be sexually active. Through time, a man may require more intense stimulation in order to become aroused. Women often find that they become more sexually responsive throughout their 20s and 30s and may peak in the late 30s or early 40s. This is likely due to greater self-confidence and reduced inhibitions about sexuality.
Sexually Transmitted Infections: Sexually transmitted infections (STIs), also referred to as sexually transmitted diseases (STDs) or venereal diseases (VDs), are illnesses that have a significant probability of transmission by means of sexual behavior, including vaginal intercourse, anal sex, and oral sex. Some STIs can also be contracted by sharing intravenous drug needles with an infected person, as well as through childbirth or breastfeeding.
Common STIs include:
chlamydia;
herpes (HSV-1 and HSV-2);
human papillomavirus (HPV);
gonorrhea;
syphilis;
trichomoniasis;
HIV (human immunodeficiency virus) and AIDS (acquired immunodeficiency syndrome).
According to the Centers for Disease Control and Prevention (CDC) (2014), there was an increase in the three most common types of STDs in 2014. These include 1.4 million cases of chlamydia, 350,000 cases of gonorrhea, and 20,000 cases of syphilis. Those most affected by STDS include those younger, gay/bisexual males, and females. The most effective way to prevent transmission of STIs is to practice safe sex and avoid direct contact of skin or fluids which can lead to transfer with an infected partner. Proper use of safe-sex supplies (such as male condoms, female condoms, gloves, or dental dams) reduces contact and risk and can be effective in limiting exposure; however, some disease transmission may occur even with these barriers.
Societal Views on Sexuality: Society’s views on sexuality are influenced by everything from religion to philosophy, and they have changed throughout history and are continuously evolving. Historically, religion has been the greatest influence on sexual behavior in the United States; however, in more recent years, peers and the media have emerged as two of the strongest influences, particularly among American teens (Potard, Courtois, & Rusch, 2008). Mass media in the form of television, magazines, movies, and music continues to shape what is deemed appropriate or normal sexuality, targeting everything from body image to products meant to enhance sex appeal. Media serves to perpetuate a number of social scripts about sexual relationships and the sexual roles of men and women, many of which have been shown to have both empowering and problematic effects on people’s (especially women’s) developing sexual identities and sexual attitudes.
Cultural Differences: In the West, premarital sex is normative by the late teens, more than a decade before most people enter marriage. In the United States and Canada, and in northern and eastern Europe, cohabitation is also normative; most people have at least one cohabiting partnership before marriage. In southern Europe, cohabiting is still taboo, but premarital sex is tolerated in emerging adulthood. In contrast, both premarital sex and cohabitation remain rare and forbidden throughout Asia. Even dating is discouraged until the late twenties, when it would be a prelude to a serious relationship leading to marriage. In cross-cultural comparisons, about three fourths of emerging adults in the United States and Europe report having had premarital sexual relations by age 20, versus less than one fifth in Japan and South Korea (Hatfield & Rapson, 2006).
Sexual Orientation: A person’s sexual orientation is their emotional and sexual attraction to a particular gender. It is a personal quality that inclines people to feel romantic or sexual attraction (or a combination of these) to persons of a given sex or gender. According to the American Psychological Association (APA) (2016), sexual orientation also refers to a person’s sense of identity based on those attractions, related behaviors, and membership in a community of others who share those attractions. Sexual orientation is independent of gender; for example, a transgender person may identify as heterosexual, homosexual, bisexual, pansexual, polysexual, asexual, or any other kind of sexuality, just like a cisgender person.
Sexual Orientation on a Continuum: Sexuality researcher Alfred Kinsey was among the first to conceptualize sexuality as a continuum rather than a strict dichotomy of gay or straight. To classify this continuum of heterosexuality and homosexuality, Kinsey et al. (1948) created a seven-point rating scale that ranged from exclusively heterosexual to exclusively homosexual. Research done over several decades has supported this idea that sexual orientation ranges along a continuum, from exclusive attraction to the opposite sex/gender to exclusive attraction to the same sex/gender (Carroll, 2016).

However, sexual orientation now can be defined in many ways. Heterosexuality, which is often referred to as being straight, is attraction to individuals of the opposite sex/gender, while homosexuality, being gay or lesbian, is attraction to individuals of one’s own sex/gender. Bisexuality was a term traditionally used to refer to attraction to individuals of either male or female sex, but it has recently been used in nonbinary models of sex and gender (i.e., models that do not assume there are only two sexes or two genders) to refer to attraction to any sex or gender. Alternative terms such as pansexuality and polysexuality have also been developed, referring to attraction to all sexes/genders and attraction to multiple sexes/genders, respectively (Carroll, 2016).
Asexuality refers to having no sexual attraction to any sex/gender. According to Bogaert (2015) about one percent of the population is asexual. Being asexual is not due to any physical problems, and the lack of interest in sex does not cause the individual any distress. Asexuality is being researched as a distinct sexual orientation.
Development of Sexual Orientation: According to current scientific understanding, individuals are usually aware of their sexual orientation between middle childhood and early adolescence. However, this is not always the case, and some do not become aware of their sexual orientation until much later in life. It is not necessary to participate in sexual activity to be aware of these emotional, romantic, and physical attractions; people can be celibate and still recognize their sexual orientation. Some researchers argue that sexual orientation is not static and inborn but is instead fluid and changeable throughout the lifespan.
There is no scientific consensus regarding the exact reasons why an individual holds a particular sexual orientation. Research has examined possible biological, developmental, social, and cultural influences on sexual orientation, but there has been no evidence that links sexual orientation to only one factor (APA, 2016). However, biological explanations, that include genetics, birth order, and hormones will be explored further as many scientists support biological processes occurring during the embryonic and and early postnatal life as playing the main role in sexual orientation (Balthazart, 2018).
Genetics: Using both twin and familial studies, heredity provides one biological explanation for same-sex orientation. Bailey and Pillard (1991) studied pairs of male twins and found that the concordance rate for identical twins was 52%, while the rate for fraternal twins was only 22%. Bailey, Pillard, Neale, and Agyei (1993) studied female twins and found a similar difference with a concordance rate of 48% for identical twins and 16% for fraternal twins. Schwartz, Kim, Kolundzija, Rieger, & Sanders (2010) found that gay men had more gay male relatives than straight men, and sisters of gay men were more likely to be lesbians than sisters of straight men.
Fraternal Birth Order: The fraternal birth order effect indicates that the probability of a boy identifying as gay increases for each older brother born to the same mother (Balthazart, 2018; Blanchard, 2001). According to Bogaret et al. “the increased incidence of homosexuality in males with older brothers results from a progressive immunization of the mother against a male specific cell-adhesion protein that plays a key role in cell-cell interactions, specifically in the process of synapse formation,” (as cited in Balthazart, 2018, p. 234). A meta-analysis indicated that the fraternal birth order effect explains the sexual orientation of between 15% and 29% of gay men.
Hormones: Excess or deficient exposure to hormones during prenatal development has also been theorized as an explanation for sexual orientation. One-third of females exposed to abnormal amounts of prenatal androgens, a condition called congenital adrenal hyperplasia (CAH), identify as bisexual or lesbian (Cohen-Bendahan, van de Beek, & Berenbaum, 2005). In contrast, too little exposure to prenatal androgens may affect male sexual orientation by not masculinizing the male brain (Carlson, 2011).
Sexual Orientation Discrimination: The United States is heteronormative, meaning that society supports heterosexuality as the norm. Consider, for example, that homosexuals are often asked, “When did you know you were gay?” but heterosexuals are rarely asked, “When did you know you were straight?” (Ryle, 2011). Living in a culture that privileges heterosexuality has a significant impact on the ways in which non-heterosexual people are able to develop and express their sexuality.
Open identification of one’s sexual orientation may be hindered by homophobia which encompasses a range of negative attitudes and feelings toward homosexuality or people who are identified or perceived as being lesbian, gay, bisexual, or transgender (LGBT). It can be expressed as antipathy, contempt, prejudice, aversion, or hatred; it may be based on irrational fear and is sometimes related to religious beliefs (Carroll, 2016). Homophobia is observable in critical and hostile behavior, such as discrimination and violence on the basis of sexual orientations that are non-heterosexual. Recognized types of homophobia include institutionalized homophobia, such as religious and state-sponsored homophobia, and internalized homophobia in which people with same-sex attractions internalize, or believe, society’s negative views and/or hatred of themselves.
Sexual minorities regularly experience stigma, harassment, discrimination, and violence based on their sexual orientation (Carroll, 2016). Research has shown that gay, lesbian, and bisexual teenagers are at a higher risk of depression and suicide due to exclusion from social groups, rejection from peers and family, and negative media portrayals of homosexuals (Bauermeister et al., 2010). Discrimination can occur in the workplace, in housing, at schools, and in numerous public settings. Much of this discrimination is based on stereotypes and misinformation. Major policies to prevent discrimination based on sexual orientation have only come into effect in the United States in the last few years.
The majority of empirical and clinical research on LGBT populations are done with largely white, middle-class, well-educated samples. This demographic limits our understanding of more marginalized sub-populations that are also affected by racism, classism, and other forms of oppression. In the United States, non-Caucasian LGBT individuals may find themselves in a double minority, in which they are not fully accepted or understood by Caucasian LGBT communities and are also not accepted by their own ethnic group (Tye, 2006). Many people experience racism in the dominant LGBT community where racial stereotypes merge with gender stereotypes.
7.3 Cognitive Development in Emerging and Early Adulthood
Distinguish between formal and postformal thought
Describe dialectical thought
Describe the changes in educational attainment and the costs of education
Describe the benefits of education beyond high school
Describe the stages in career development, millennial employment, and NEETS
Describe sexism and how it affects pay, hiring, employment, and education
7.3.1 Beyond Formal Operational Thought: Postformal Thought
As mentioned in chapter 6, according to Piaget’s theory adolescents acquire formal operational thought. The hallmark of this type of thinking is the ability to think abstractly or to consider possibilities and ideas about circumstances never directly experienced. Thinking abstractly is only one characteristic of adult thought, however. If you compare a 15 year-old with someone in their late 30s, you would probably find that the latter considers not only what is possible, but also what is likely. Why the change? The adult has gained experience and understands why possibilities do not always become realities. They learn to base decisions on what is realistic and practical, not idealistic, and can make adaptive choices. Adults are also not as influenced by what others think. This advanced type of thinking is referred to as Postformal Thought (Sinnott, 1998).
Dialectical Thought: In addition to moving toward more practical considerations, thinking in early adulthood may also become more flexible and balanced. Abstract ideas that the adolescent believes in firmly may become standards by which the adult evaluates reality. Adolescents tend to think in dichotomies; ideas are true or false; good or bad; and there is no middle ground. However, with experience, the adult comes to recognize that there is some right and some wrong in each position, some good or some bad in a policy or approach, some truth and some falsity in a particular idea. This ability to bring together salient aspects of two opposing viewpoints or positions is referred to as dialectical thought and is considered one of the most advanced aspects of postformal thinking (Basseches, 1984). Such thinking is more realistic because very few positions, ideas, situations, or people are completely right or wrong. So, for example, parents who were considered angels or devils by the adolescent eventually become just people with strengths and weaknesses, endearing qualities, and faults to the adult.
Does everyone reach postformal or even formal operational thought? Formal operational thought involves being able to think abstractly; however, this ability does not apply to all situations or all adults. Formal operational thought is influenced by experience and education. Some adults lead lives in which they are not challenged to think abstractly about their world. Many adults do not receive any formal education and are not taught to think abstractly about situations they have never experienced. Further, they are also not exposed to conceptual tools used to formally analyze hypothetical situations. Those who do think abstractly may be able to do so more easily in some subjects than others. For example, psychology majors may be able to think abstractly about psychology but be unable to use abstract reasoning in physics or chemistry. Abstract reasoning in a particular field requires a knowledge base we might not have in all areas. Consequently, our ability to think abstractly often depends on our experiences.
7.3.2 Education
According to the National Center for Higher Education Management Systems (NCHEMS) (2016a, 2016b, 2016c, 2016d), in the United States:
84% of 18 to 24 year olds and 88% of those 25 and older have a high school diploma or its equivalent
36% of 18 to 24 year olds and 7% of 25 to 49 year olds attend college
59% of those 25 and older have completed some college
32.5% of those 25 and older have a bachelor’s degree or higher, with slightly more women (33%) than men (32%) holding a college degree (Ryan & Bauman, 2016).
The rate of college attainment has grown more slowly in the United States than in a number of other nations in recent years (OCED, 2014). This may be due to fact that the cost of attaining a degree is higher in the U.S. than in many other nations.
In 2017, 65% of college seniors who graduated from private and public nonprofit colleges had student loan debt, and nationally owed an average of $28,650, a 1% decline from 2016 (The Institute for College Access & Success (TICAS), 2018). See Figure 7.17 for yearly comparisons.
According to the most recent TICAS annual report, the rate of debt varied widely across states, as well as between colleges. The after graduation debt ranged from 18,850 in Utah to $38,500 in Connecticut. Low-debt states are mainly in the West, and high-debt states in the Northeast. In recent years there has been a concern about students carrying more debt and being more likely to default when attending for-profit institutions. In 2016, students at for-profit schools borrowed an average of $39,900, which was 41% higher than students at non-profit schools that year. In addition, 30% of students attending for-profit colleges default on their federal student loans. In contrast, the default level of those who attended public institutions is only 4% (TICAS, 2018).
College student debt has become a key issue at both the state and federal political level, and some states have been taking steps to increase spending and grants to help students with the cost of college. However, 15% of the Class of 2017’s college debt was owed to private lenders (TICAS, 2018). Such debt has less consumer protection, fewer options for repayment, and is typically negotiated at a higher interest rate. See Table 7.1 for a debt comparison of 6 U.S. States.
Graduate School: Larger amounts of student debt actually occur at the graduate level (Kreighbaum, 2019). In 2019, the highest average debts were concentrated in the medical fields. Average median debt for graduate programs included:
$42,335 for a master’s degree
$95,715 for a doctoral degree
$141,000 for a professional degree
Worldwide, over 80% of college educated adults are employed, compared with just over 70% of those with a high school or equivalent diploma, and only 60% of those with no high school diploma (OECD, 2015). Those with a college degree will earn more over the course of their life time. Moreover, the benefits of college education go beyond employment and finances. The OECD found that around the world, adults with higher educational attainment were more likely to volunteer, felt they had more control over their lives, and thus were more interested in the world around them. Studies of U.S. college students find that they gain a more distinct identity and become more socially competent, less dogmatic and ethnocentric compared to those not in college (Pascarella, 2006).
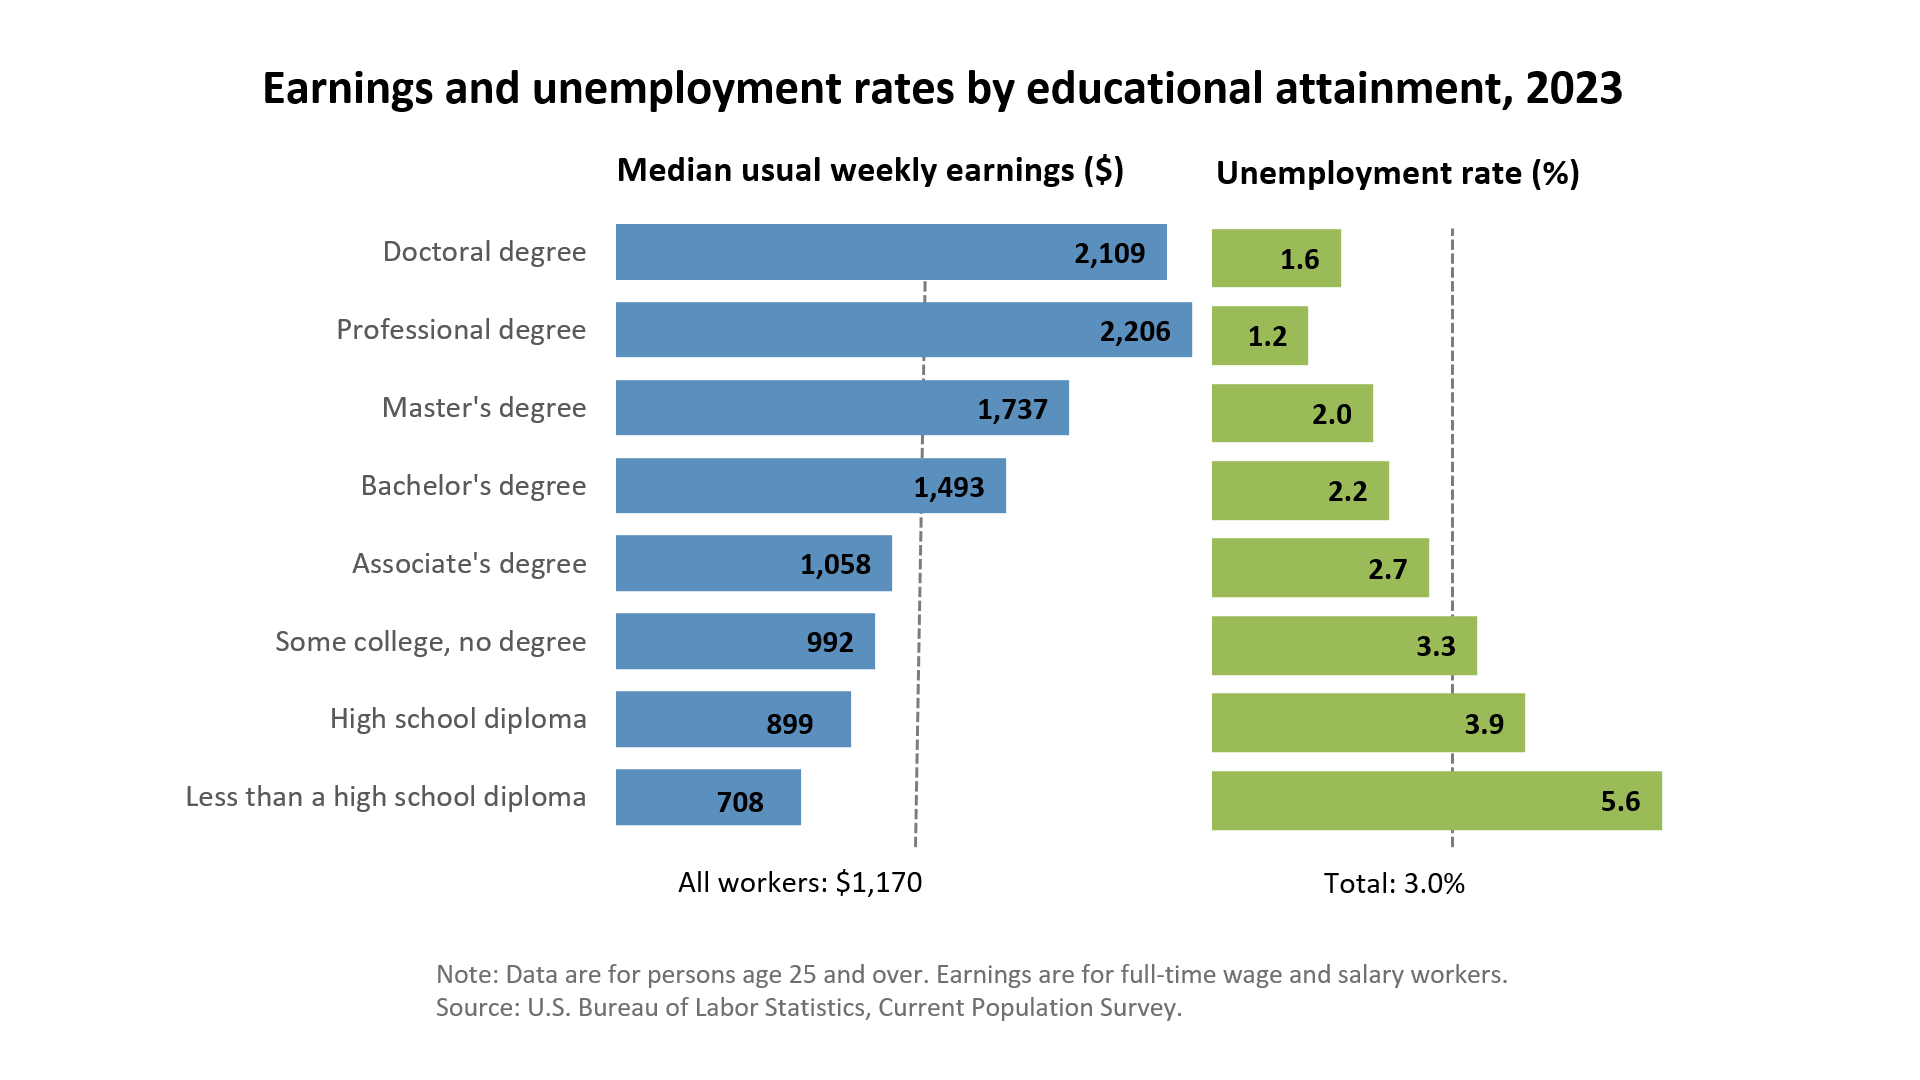
Is college worth the time and investment? College is certainly a substantial investment each year, with the financial burden falling on students and their families in the U.S., and mainly by the government in many other nations. Nonetheless, the benefits both to the individual and the society outweighs the initial costs. As can be seen in Figure 7.18, those in America with the most advanced degrees earn the highest income and have the lowest unemployment.
7.3.3 Career Development and Employment
Work plays a significant role in the lives of people, and emerging and early adulthood is the time when most of us make choices that will establish our careers. Career development has a number of stages:
Stage One: As children we may select careers based on what appears glamorous or exciting to us (Patton & McMahon, 1999). There is little regard in this stage for whether we are suited for our occupational choices.
Stage Two: In the second stage, teens include their abilities and limitations, in addition to the glamour of the occupation when narrowing their choices.
Stage Three: Older teens and emerging adults narrow their choices further and begin to weigh more objectively the requirements, rewards, and downsides to careers, along with comparing possible careers with their own interests, values, and future goals (Patton & McMahon, 1999). However, some young people in this stage “fall-into” careers simply because these were what were available at the time, because of family pressures to pursue particular paths, or because these were high paying jobs, rather than from an intrinsic interest in that career path (Patton & McMahon, 1999).
Stage Four: Super (1980) suggests that by our mid to late thirties, many adults settle in their careers. Even though they might change companies or move up in their position, there is a sense of continuity and forward motion in their career. However, some people at this point in their working life may feel trapped, especially if there is little opportunity for advancement in a more dead-end job.
How have things changed for Millennials compared with previous generations of early adults? In recent years, young adults are more likely to find themselves job-hopping, and periodically returning to school for further education and retraining than in prior generations. However, researchers find that occupational interests remain fairly stable. Thus, despite the more frequent change in jobs, most people are generally seeking jobs with similar interests rather than entirely new careers (Rottinghaus, Coon, Gaffey & Zytowski, 2007). As of 2016, millennials became the largest generation in the labor force (Fry, 2018) (See Figure 7.19).
Recent research also suggests that Millennials are looking for something different in their place of employment. According to a recent Gallup poll report (2016), Millennials want more than a paycheck, they want a purpose. Unfortunately, only 29% of Millennials surveyed by Gallup reported that they were “engaged” at work. In fact, they report being less engaged than Gen Xers and Baby Boomers; with 55% of Millennials saying they are not engaged at all with their job. This indifference to their workplace may explain the greater tendency to switch jobs. With their current job giving them little reason to stay, they are more likely to take any new opportunity to move on. Only half of Millennials saw themselves working at the same company a year later. Gallup estimates that this employment turnover and lack of engagement costs businesses $30.5 billion a year.
NEETs: Around the world, teens and young adults were some of the hardest hit by the economic downturn in recent years (Desilver, 2016). Consequently, a number of young people have become NEETs, neither employed nor in education or training. While the number of young people who are NEETs has declined more recently, there is concern that “without assistance, economically inactive young people won’t gain critical job skills and will never fully integrate into the wider economy or achieve their full earning potential” (Desilver, 2016, para. 3). In parts of the world where the rates of NEETs are persistently high, there is also concern that having such large numbers of young adults with little opportunity may increase the chances of social unrest.
In the United States, in 2017 over 13% of 15 to 29 year-olds were neither employed nor in school, (Organisation for Economic Cooperation and Development, (OECD), 2019). This is down from 2013, when approximately 18.5% of this age group fit the category (Desilver, 2016). More young women than men in the United States find themselves unemployed and not in school or training for a job. Additionally, most NEETs have high school or less education, and Asians are less likely to be NEETs than any other ethnic group in the US (Desilver, 2016).
The rate of NEETs varies around the world, with higher rates found in nations that have been the hardest hit by economic recessions, and government austerity measures. The number of NEETs also varies widely between the genders, although females are more likely to be NEETs in all nations (see Table 7.1).
| Country | Females | Males | Overall |
|---|---|---|---|
| Australia | 12.80 | 9.14 | 10.9 |
| Canada | 11.83 | 12.46 | 12.2 |
| Denmark | 11.86 | 11.67 | 11.8 |
| France | 17.75 | 15.34 | 16.5 |
| Germany | 11.27 | 7.60 | 9.3 |
| Italy | 26.94 | 23.38 | 25.1 |
| Mexico | 34.21 | 7.90 | 21.2 |
| Russia | 16.28 | 8.66 | 12.4 |
| Sweden | 8.42 | 7.69 | 8.0 |
| Turkey | 39.90 | 15.08 | 27.2 |
| United Kingdom | 13.95 | 10.50 | 12.2 |
| United States of America | 15.69 | 10.89 | 13.3 |
What role does gender play on career and employment? Gender also has an impact on career choices. Despite the rise in the number of women who work outside of the home, there are some career fields that are still pursued more by men than women. Jobs held by women still tend to cluster in the service sector, such as education, nursing, and child-care worker. While in more technical and scientific careers, women are greatly outnumbered by men. Jobs that have been traditionally held by women tend to have lower status, pay, benefits, and job security (Bosson, et al., 2019). In recent years, women have made inroads into fields once dominated by males, and today women are almost as likely as men to become medical doctors or lawyers. Despite these changes, women are more likely to have lower-status, and thus less pay than men in these professions. For instance, women are more likely to be a family practice doctor than a surgeon or are less likely to make partner in a law firm (Ceci & Williams, 2007).Sexism
Sexism or gender discrimination is prejudice or discrimination based on a person’s sex or gender (Bosson, Vandello, & Buckner, 2019). Sexism can affect any sex that is marginalized or oppressed in a society; however, it is particularly documented as affecting females. It has been linked to stereotypes and gender roles and includes the belief that males are intrinsically superior to other sexes and genders. Extreme sexism may foster sexual harassment, rape, and other forms of sexual violence.
Sexism can exist on a societal level, such as in hiring, employment opportunities, and education. In the United States, women are less likely to be hired or promoted in male-dominated professions, such as engineering, aviation, and construction (Blau, Ferber, & Winkler, 2010; Ceci & Williams, 2011). In many areas of the world, young girls are not given the same access to nutrition, healthcare, and education as boys. Sexism also includes people’s expectations of how members of a gender group should behave. For example, women are expected to be friendly, passive, and nurturing; when a woman behaves in an unfriendly or assertive manner, she may be disliked or perceived as aggressive because she has violated a gender role (Rudman, 1998). In contrast, a man behaving in a similarly unfriendly or assertive way might be perceived as strong or even gain respect in some circumstances.
Occupational sexism involves discriminatory practices, statements, or actions, based on a person’s sex, that occur in the workplace. One form of occupational sexism is wage discrimination. In 2008, the Organisation for Economic Co-operation and Development (OECD) found that while female employment rates have expanded, and gender employment and wage gaps have narrowed nearly everywhere, on average women still have a 20 percent less chance to have a job. The Council of Economic Advisors (2015) found that despite women holding 49.3% of the jobs, they are paid only 78 cents for every $1.00 a man earns. It also found that despite the fact that many countries, including the U.S., have established anti-discrimination laws, these laws are difficult to enforce. A recent example of significant wage inequality occurred among athletes.
2019 Women’s World Cup: The world witnessed the tremendous athleticism and soccer skills demonstrated by female players from 24 different countries during the 2019 Women’s World Cup. Amid the cheering at the end of the final match between the United States and the Netherlands, were chants of “equal pay” (Channick, 2019). Throughout the tournament, attention was focused on the discrepancy between what male soccer players earned compared to the female players. In winning the World Cup, the American women’s team earned $4 million as part of a $30 million prize pool (Peterson, 2019). In contrast, the French men’s team, who won the Men’s World Cup in 2018, earned $38 million as part of the $400 million prize pool. The Federation of Association Football (FIFA) promised to double the prize money to $60 million for the 2023 Women’s World Cup, but that still lags far behind the $440 million that will be given out for the Men’s World Cup in 2022. In the United States, the women’s soccer team generates more revenue and receives higher TV ratings than the men’s team, yet the women get paid significantly less. By winning the 2019 Women’s World Cup, each woman should receive $200,000, yet if the American men had won the 2018 Men’s World Cup, each would have received $1.1 million (Hess, 2019). Because of this discrepancy, in March 2019, 28 members of the women’s team filed a lawsuit against the United States Soccer Federation for gender discrimination and unequal pay (Channick, 2019).
Factors Affecting Wage Inequality: There are many possible explanations for the wage gap. It has been argued in the past that education may account for the wage gap. However, the wage gap exists at every of education level (Bosson et al., 2019). Men with less than high school to men with graduate degree earn more than women with the same level of education. In addition, women now attain more associates, bachelor’s, and master’s degrees than men, and very similar levels of professional degrees and doctorates, according to a recent Census survey (U.S. Census Bureau, 2019). As the wage gap still exists in most occupations it cannot be the explanation. Instead, occupational segregation is a likely contributor to the overall wage gap, as women tend to work in very different occupations than men, and those jobs tend to have lower wages. In addition, the entry of women into a field tends to reduce the wages and prestige of the job. Mandel (2013) found that jobs typically held by men who saw the biggest influx of women into those careers, also saw the biggest drop in wages.
Sticky floors, which keep low-wage workers, who are more likely to be women and minorities, from being promoted contribute to lower wages (Bosson, et al. 2019). Women are disproportionately in low-paid occupations, such as clerical, childcare, and service workers (Hegewisch & Ellis, 2015). They also get paid less than men in the same jobs, as can be seen in Table 7.2. This is a list of some of the top jobs held by women (e.g., maid, social worker, nurse) and top jobs held by men (e.g., software developer, janitor, police officer) in the United States. The second column shows women’s earnings as a percentage of the earnings of men in those careers. In only one occupation are women paid more than men on average; stock clerk. Men are not only being paid more in more masculine jobs, but also in jobs typically held by women.
| Occupation | Wage Gap |
| Stock clerk, order filler | 102 |
| Maid, housekeeping cleaner | 99 |
| Social worker | 94.1 |
| Registered nurse | 90.4 |
| Customer service representative | 86.8 |
| Secretary/administrative assistant | 84.5 |
| Software developer | 83.9 |
| Office supervisor | 83 |
| Waitress/waiter | 82.8 |
| Accountant, auditor | 80.8 |
| Janitor, building cleaner | 76.9 |
| Driver/sales worker/truck driver | 73.7 |
| Police and sheriff’s patrol officer | 71.2 |
Other factors include that more than half of men report having negotiated their salary when being hired, compared with 12% of women (Babcock, Gelfand, Small, & Stayn, 2006). However, people perceive women who negotiate more negatively then they do men, as assertive women, but not men, are more likely to be penalized. Women are also more likely to have interruptions in their careers either through the birth of children, or relocation due to a change in their partner’s job. Women are also less likely to relocate for the sake of their families when a better job offer comes along, and employers know this. It has been suggested that one reason why males may be offered more money is to keep them from leaving (Baldridge, Eddleston, & Vega, 2006). Aditionally, men are more likely to work overtime.
Barriers to Positions of Power: There are a few barriers to women achieving positions of power. The glass ceiling is the invisible barrier that keeps women and minorities from rising to higher positions regardless of their qualifications (Bosson et al., 2019). Women hold only 4.5% of CEO positions and 14% of top executive positions around the world (Noland, Moran, & Kotschwar, 2016). In addition, Noland and colleagues found that in a study of nearly 22,000 companies worldwide, in 77% of those firms only 30% of women held an executive position or board seat. There were only 11 companies, or 0.05% of all the firms studied, where women held all the executive positions and board seats. Some researchers see the root cause of this situation in the tacit discrimination based on gender, conducted by current top executives and corporate directors, who are primarily male.
Often the barriers to achieving one’s goals are not obvious. For instance, some argue that the gender role stereotypes cast managerial positions as “masculine”. Unfortunately, when women do rise to positions of power it is often at a time when a company or country is faced with a major crisis. This is called the glass cliff, and it refers to women and minorities being placed in leadership positions when the risk of failure is high. For instance, female lawyers are more likely than their male counterparts to lead a high-risk cases, and female politicians are more likely to be recommended to run in unwinnable seats (Bruckmuller, Ryan, Floor, & Haslam, 2014).
Worldwide Gender Parity: The World Economic Forum (2017) introduced The Global Gender Gap Report in 2006 as way of tracking gender based disparities between men and women in the world. The most recent report in 2017 analyzed 144 countries on gender equality in the areas of: economic participation and opportunity, educational attainment, health and survival, and political empowerment. Countries are then ranked to create global awareness of the challenges posed by gender gaps in different areas of the world. A parity rating of 100% would mean that females and males achieved equality on these measures. Results indicated:
68% gender parity was found worldwide across the four areas. Specifically, there was 96% parity in health outcomes, 95% parity in educational attainment, 58% parity in economic participation, and only 23% parity in political empowerment.
The top spots were held by smaller Western European countries, particularly the Nordic countries as Iceland (88% parity), Norway (83% parity) and Finland (82% parity) occupied the top three positions.
The United States ranked 49th with 72% gender parity.
Following the current trends, it will take 100 years for global gender parity.
Improving gender parity is expected to provide significant economic gains for a country and closing the occupational gender gaps would be one way to achieve this.
7.4 Psychosocial Development in Emerging and Early Adulthood
Describe the relationship between infant and adult temperament • Explain personality in early adulthood • Explain the five factor model of personality • Describe adult attachment styles • Describe Erikson’s stage of intimacy vs. isolation • Identify the factors affecting attraction • Differentiate among the types of love • Describe adult lifestyles, including singlehood, cohabitation and marriage • Describe the factors that influence parenting
7.4.1 Temperament and Personality in Adulthood
If you remember from chapter 3, temperament is defined as the innate characteristics of the infant, including mood, activity level, and emotional reactivity, noticeable soon after birth. Does one’s temperament remain stable through the lifespan? Do shy and inhibited babies grow up to be shy adults, while the sociable child continues to be the life of the party? Like most developmental research the answer is more complicated than a simple yes or no. Chess and Thomas (1987), who identified children as easy, difficult, slow-to-warm-up or blended, found that children identified as easy grew up to became well-adjusted adults, while those who exhibited a difficult temperament were not as well-adjusted as adults. Kagan (2002) studied the temperamental category of inhibition to the unfamiliar in children. Infants exposed to unfamiliarity reacted strongly to the stimuli and cried loudly, pumped their limbs, and had an increased heart rate. Research has indicated that these highly reactive children show temperamental stability into early childhood, and Bohlin and Hagekull (2009) found that shyness in infancy was linked to social anxiety in adulthood.
An important aspect of this research on inhibition was looking at the response of the amygdala, which is important for fear and anxiety, especially when confronted with possible threatening events in the environment. Using functional magnetic resonance imaging (FMRIs) young adults identified as strongly inhibited toddlers showed heightened activation of the amygdala when compared to those identified as uninhibited toddlers (Davidson & Begley, 2012).
The research does seem to indicate that temperamental stability holds for many individuals through the lifespan, yet we know that one’s environment can also have a significant impact. Recall from our discussion on epigenesis or how environmental factors are thought to change gene expression by switching genes on and off. Many cultural and environmental factors can affect one’s temperament, including supportive versus abusive child-rearing, socioeconomic status, stable homes, illnesses, teratogens, etc. Additionally, individuals often choose environments that support their temperament, which in turn further strengthens them (Cain, 2012). In summary, because temperament is genetically driven, genes appear to be the major reason why temperament remains stable into adulthood. In contrast, the environment appears mainly responsible for any change in temperament (Clark & Watson, 1999).
Everybody has their own unique personality; that is, their characteristic manner of thinking, feeling, behaving, and relating to others (John, Robins, & Pervin, 2008). Personality traits refer to these characteristic, routine ways of thinking, feeling, and relating to others. Personality integrates one’s temperament with cultural and environmental influences. Consequently, there are signs or indicators of these traits in childhood, but they become particularly evident when the person is an adult. Personality traits are integral to each person’s sense of self, as they involve what people value, how they think and feel about things, what they like to do, and, basically, what they are like most every day throughout much of their lives.
| Dimension | Description | Examples of behaviors predicted by the trait |
|---|---|---|
| Openness to experience | A general appreciation for art, emotion, adventure, unusual ideas, imagination, curiosity, and variety of experience | Individuals who are highly open to experience tend to have distinctive and unconventional decorations in their home. They are also likely to have books on a wide variety of topics, a diverse music collection, and works of art on display. |
| Conscientiousness | A tendency to show self- discipline, act dutifully, and aim for achievement | Individuals who are conscientious have a preference for planned rather than spontaneous behavior. |
| Extraversion | The tendency to experience positive emotions and to seek out stimulation and the company of others | Extroverts enjoy being with people. In groups they like to talk, assert themselves, and draw attention to themselves. |
| Agreeableness | A tendency to be compassionate and cooperative rather than suspicious and antagonistic toward others; reflects individual differences in general concern for social harmony | Agreeable individuals value getting along with others. They are generally considerate, friendly, generous, helpful, and willing to compromise their interests with those of others. |
| Neuroticism | The tendency to experience negative emotions, such as anger, anxiety, or depression; sometimes called “emotional instability” | Those who score high in neuroticism are more likely to interpret ordinary situations as threatening and minor frustrations as hopelessly difficult. They may have trouble thinking clearly, making decisions, and coping effectively with stress. |
Five-Factor Model: There are hundreds of different personality traits, and all of these traits can be organized into the broad dimensions referred to as the Five-Factor Model (John, Naumann, & Soto, 2008). These five broad domains include: Openness, Conscientiousness, Extraversion, Agreeableness, and Neuroticism (Think OCEAN to remember). This applies to traits that you may use to describe yourself. Table 7.4 provides illustrative traits for low and high scores on the five domains of this model of personality.
Does personality change throughout adulthood? Previously the answer was no, but contemporary research shows that although some people’s personalities are relatively stable over time, others’ are not (Lucas & Donnellan, 2011; Roberts & Mroczek, 2008). Longitudinal studies reveal average changes during adulthood in the expression of some traits (e.g., neuroticism and openness decrease with age and conscientiousness increases) and individual differences in these patterns due to idiosyncratic life events (e.g., divorce, illness). Longitudinal research also suggests that adult personality traits, such as conscientiousness, predict important life outcomes including job success, health, and longevity (Friedman et al., 1993; Roberts, Kuncel, Shiner, Caspi, & Goldberg, 2007).
The Harvard Health Letter (2012) identifies research correlations between conscientiousness and lower blood pressure, lower rates of diabetes and stroke, fewer joint problems, being less likely to engage in harmful behaviors, being more likely to stick to healthy behaviors, and more likely to avoid stressful situations. Conscientiousness also appears related to career choices, friendships, and stability of marriage. Lastly, a person possessing both self-control and organizational skills, both related to conscientiousness, may withstand the effects of aging better and have stronger cognitive skills than one who does not possess these qualities.
7.4.2 Attachment in Young Adulthood
Hazan and Shaver (1987) described the attachment styles of adults, using the same three general categories proposed by Ainsworth’s research on young children: secure, avoidant, and anxious/ambivalent. Hazan and Shaver developed three brief paragraphs describing the three adult attachment styles. Adults were then asked to think about romantic relationships they were in and select the paragraph that best described the way they felt, thought, and behaved in these relationships (See Table 7.4).
| Which of the following best describes you in your romantic relationships? | |
| Secure | I find it relatively easy to get close to others and am comfortable depending on them and having them depend on me. I don’t often worry about being abandoned or about someone getting too close to me. |
| Avoidant | I am somewhat uncomfortable being close to others; I find it difficult to trust them completely, difficult to allow myself to depend on them. I am nervous when anyone gets too close, and often, love partners want me to be more intimate than I feel comfortable being. |
| Anxious/Ambivalent | I find that others are reluctant to get as close as I would like. I often worry that my partner doesn’t really love me or won’t stay with me. I want to merge completely with another person, and this sometimes scares people away. |
Bartholomew (1990) challenged the categorical view of attachment in adults and suggested that adult attachment was best described as varying along two dimensions; attachment related-anxiety and attachment-related avoidance. Attachment-related anxiety refers to the extent to which an adult worries about whether their partner really loves them. Those who score high on this dimension fear that their partner will reject or abandon them (Fraley, Hudson, Heffernan, & Segal, 2015). Attachment-related avoidance refers to whether an adult can open up to others, and whether they trust and feel they can depend on others. Those who score high on attachment-related avoidance are uncomfortable with opening up and may fear that such dependency may limit their sense of autonomy (Fraley et al., 2015). According to Bartholomew (1990) this would yield four possible attachment styles in adults; secure, dismissing, preoccupied, and fearful-avoidant (see Figure 7.22).
Securely attached adults score lower on both dimensions. They are comfortable trusting their partners and do not worry excessively about their partner’s love for them. Adults with a dismissing style score low on attachment-related anxiety, but higher on attachment-related avoidance. Such adults dismiss the importance of relationships. They trust themselves, but do not trust others, thus do not share their dreams, goals, and fears with others. They do not depend on other people and feel uncomfortable when they have to do so.
Those with a preoccupied attachment are low in attachment-related avoidance, but high in attachment-related anxiety. Such adults are often prone to jealousy and worry that their partner does not love them as much as they need to be loved. Adults whose attachment style is fearful-avoidant score high on both attachment-related avoidance and attachment-related anxiety. These adults want close relationships, but do not feel comfortable getting emotionally close to others. They have trust issues with others and often do not trust their own social skills in maintaining relationships.
Research on attachment in adulthood has found that:
Adults with insecure attachments report lower satisfaction in their relationships (Butzer, & Campbell, 2008; Holland, Fraley, & Roisman, 2012).
Those high in attachment-related anxiety report more daily conflict in their relationships (Campbell, Simpson, Boldry, & Kashy, 2005).
Those with avoidant attachment exhibit less support to their partners (Simpson, Rholes, Oriña, & Grich, 2002).
Young adults show greater attachment-related anxiety than do middle-aged or older adults (Chopik, Edelstein, & Fraley, 2013).
Some studies report that young adults show more attachment-related avoidance (Schindler, Fagundes, & Murdock, 2010), while other studies find that middle-aged adults show higher avoidance than younger or older adults (Chopik et al., 2013).
Young adults with more secure and positive relationships with their parents make the transition to adulthood more easily than do those with more insecure attachments (Fraley, 2013).
Young adults with secure attachments and authoritative parents were less likely to be depressed than those with authoritarian or permissive parents or who experienced an avoidant or ambivalent attachment (Ebrahimi, Amiri, Mohamadlou, & Rezapur, 2017).
Do people with certain attachment styles attract those with similar styles? When people are asked what kinds of psychological or behavioral qualities they are seeking in a romantic partner, a large majority of people indicate that they are seeking someone who is kind, caring, trustworthy, and understanding, that is the kinds of attributes that characterize a “secure” caregiver (Chappell & Davis, 1998). However, we know that people do not always end up with others who meet their ideals. Are secure people more likely to end up with secure partners, and, vice versa, are insecure people more likely to end up with insecure partners? The majority of the research that has been conducted to date suggests that the answer is “yes.” Frazier, Byer, Fischer, Wright, and DeBord (1996) studied the attachment patterns of more than 83 heterosexual couples and found that, if the man was relatively secure, the woman was also likely to be secure.
One important question is whether these findings exist because (a) secure people are more likely to be attracted to other secure people, (b) secure people are likely to create security in their partners over time, or (c) some combination of these possibilities. Existing empirical research strongly supports the first alternative. For example, when people have the opportunity to interact with individuals who vary in security in a speed-dating context, they express a greater interest in those who are higher in security than those who are more insecure (McClure, Lydon, Baccus, & Baldwin, 2010). However, there is also some evidence that people’s attachment styles mutually shape one another in close relationships. For example, in a longitudinal study, Hudson, Fraley, Vicary, and Brumbaugh (2012) found that, if one person in a relationship experienced a change in security, his or her partner was likely to experience a change in the same direction.
Do early experiences as children shape adult attachment? The majority of research on this issue is retrospective; that is, it relies on adults’ reports of what they recall about their childhood experiences. This kind of work suggests that secure adults are more likely to describe their early childhood experiences with their parents as being supportive, loving, and kind (Hazan & Shaver, 1987). A number of longitudinal studies are emerging that demonstrate prospective associations between early attachment experiences and adult attachment styles and/or interpersonal functioning in adulthood. For example, Fraley, Roisman, Booth-LaForce, Owen, and Holland (2013) found in a sample of more than 700 individuals studied from infancy to adulthood that maternal sensitivity across development prospectively predicted security at age 18. Simpson, Collins, Tran, and Haydon (2007) found that attachment security, assessed in infancy in the strange situation, predicted peer competence in grades one to three, which, in turn, predicted the quality of friendship relationships at age 16, which, in turn, predicted the expression of positive and negative emotions in their adult romantic relationships at ages 20 to 23.
It is easy to come away from such findings with the mistaken assumption that early experiences “determine” later outcomes. To be clear, attachment theorists assume that the relationship between early experiences and subsequent outcomes is probabilistic, not deterministic. Having supportive and responsive experiences with caregivers early in life is assumed to set the stage for positive social development, but that does not mean that attachment patterns are set in stone. In short, even if an individual has far from optimal experiences in early life, attachment theory suggests that it is possible for that individual to develop well-functioning adult relationships through a number of corrective experiences, including relationships with siblings, other family members, teachers, and close friends. Security is best viewed as a culmination of a person’s attachment history rather than a reflection of his or her early experiences alone. Those early experiences are considered important, not because they determine a person’s fate, but because they provide the foundation for subsequent experiences.
7.4.3 Relationships with Parents and Siblings
In early adulthood the parent-child relationship has to transition toward a relationship between two adults. This involves a reappraisal of the relationship by both parents and young adults. One of the biggest challenges for parents, especially during emerging adulthood, is coming to terms with the adult status of their children. Aquilino (2006) suggests that parents who are reluctant or unable to do so may hinder young adults’ identity development. This problem becomes more pronounced when young adults still reside with their parents. Arnett (2004) reported that leaving home often helped promote psychological growth and independence in early adulthood.
Sibling relationships are one of the longest-lasting bonds in people’s lives. Yet, there is little research on the nature of sibling relationships in adulthood (Aquilino, 2006). What is known is that the nature of these relationships change, as adults have a choice as to whether they will maintain a close bond and continue to be a part of the life of a sibling. Siblings must make the same reappraisal of each other as adults, as parents have to with their adult children. Research has shown a decline in the frequency of interactions between siblings during early adulthood, as presumably peers, romantic relationships, and children become more central to the lives of young adults. Aquilino (2006) suggests that the task in early adulthood may be to maintain enough of a bond so that there will be a foundation for this relationship in later life. Those who are successful can often move away from the “older-younger” sibling conflicts of childhood, toward a more equal relationship between two adults. Siblings that were close to each other in childhood are typically close in adulthood (Dunn, 1984, 2007), and in fact, it is unusual for siblings to develop closeness for the first time in adulthood. Overall, the majority of adult sibling relationships are close (Cicirelli, 2009).
7.4.4 Erikson: Intimacy vs. Isolation
Erikson’s (1950, 1968) sixth stage focuses on establishing intimate relationships or risking social isolation. Intimate relationships are more difficult if one is still struggling with identity. Achieving a sense of identity is a life-long process, as there are periods of identity crisis and stability. However, once identity is established intimate relationships can be pursued. These intimate relationships include acquaintanceships and friendships, but also the more important close relationships, which are the long-term romantic relationships that we develop with another person, for instance, in a marriage (Hendrick & Hendrick, 2000).
7.4.5 Factors influencing Attraction
Because most of us enter into a close relationship at some point, it is useful to know what psychologists have learned about the principles of liking and loving. A major interest of psychologists is the study of interpersonal attraction, or what makes people like, and even love, each other.
Similarity: One important factor in attraction is a perceived similarity in values and beliefs between the partners (Davis & Rusbult, 2001). Similarity is important for relationships because it is more convenient if both partners like the same activities and because similarity supports one’s values. We can feel better about ourselves and our choice of activities if we see that our partner also enjoys doing the same things that we do. Having others like and believe in the same things we do makes us feel validated in our beliefs. This is referred to as consensual validation and is an important aspect of why we are attracted to others.

_-_geograph.org.uk_-_651467.jpg)
Self-Disclosure: Liking is also enhanced by self-disclosure, the tendency to communicate frequently, without fear of reprisal, and in an accepting and empathetic manner. Friends are friends because we can talk to them openly about our needs and goals and because they listen and respond to our needs (Reis & Aron, 2008). However, self-disclosure must be balanced. If we open up about our concerns that are important to us, we expect our partner to do the same in return. If the self-disclosure is not reciprocal, the relationship may not last.
Proximity: Another important determinant of liking is proximity, or the extent to which people are physically near us. Research has found that we are more likely to develop friendships with people who are nearby, for instance, those who live in the same dorm that we do, and even with people who just happen to sit nearer to us in our classes (Back, Schmukle, & Egloff, 2008).
Proximity has its effect on liking through the principle of mere exposure, which is the tendency to prefer stimuli (including, but not limited to people) that we have seen more frequently. The effect of mere exposure is powerful and occurs in a wide variety of situations. Infants tend to smile at a photograph of someone they have seen before more than they smile at a photograph of someone they are seeing for the first time (Brooks-Gunn & Lewis, 1981), and people prefer side-to-side reversed images of their own faces over their normal (nonreversed) face, whereas their friends prefer their normal face over the reversed one (Mita, Dermer, & Knight, 1977). This is expected on the basis of mere exposure, since people see their own faces primarily in mirrors, and thus are exposed to the reversed face more often.
Mere exposure may well have an evolutionary basis. We have an initial fear of the unknown, but as things become familiar, they seem more similar and safer, and thus produce more positive affect and seem less threatening and dangerous (Harmon-Jones & Allen, 2001; Freitas, Azizian, Travers, & Berry, 2005). When the stimuli are people, there may well be an added effect. Familiar people become more likely to be seen as part of the ingroup rather than the outgroup, and this may lead us to like them more. Zebrowitz and her colleagues found that we like people of our own race in part because they are perceived as similar to us (Zebrowitz, Bornstad, & Lee, 2007).
7.4.6 Friendships
In our twenties, intimacy needs may be met in friendships rather than with partners. This is especially true in the United States today as many young adults postpone making long-term commitments to partners, either in marriage or in cohabitation. The kinds of friendships shared by women tend to differ from those shared by men (Tannen, 1990). Friendships between men are more likely to involve sharing information, providing solutions, or focusing on activities rather than discussion problems or emotions. Men tend to discuss opinions or factual information or spend time together in an activity of mutual interest. Friendships between women are more likely to focus on sharing weaknesses, emotions, or problems. Women talk about difficulties they are having in other relationships and express their sadness, frustrations, and joys. These differences in approaches lead to problems when men and women come together. She may want to vent about a problem she is having; he may want to provide a solution and move on to some activity. But when he offers a solution, she thinks he does not care. Friendships between men and women become more difficult because of the unspoken question about whether the friendships will lead to a romantic involvement. Consequently, friendships may diminish once a person has a partner or single friends may be replaced with couple friends.
7.4.7 Love
Sternberg (1988) suggests that there are three main components of love: Passion, intimacy, and commitment (see Figure 7.25). Love relationships vary depending on the presence or absence of each of these components. Passion refers to the intense, physical attraction partners feel toward one another. Intimacy involves the ability the share feelings, psychological closeness and personal thoughts with the other. Commitment is the conscious decision to stay together. Passion can be found in the early stages of a relationship, but intimacy takes time to develop because it is based on knowledge of the partner. Once intimacy has been established, partners may resolve to stay in the relationship. Although many would agree that all three components are important to a relationship, many love relationships do not consist of all three. Let’s look at other possibilities.

Sternberg’s Triarchic Theory of Love Source
Liking: In this relationship, intimacy or knowledge of the other and a sense of closeness is present. Passion and commitment, however, are not. Partners feel free to be themselves and disclose personal information. They may feel that the other person knows them well and can be honest with them and let them know if they think the person is wrong. These partners are friends. However, being told that your partner “thinks of you as a friend” can be a devastating blow if you are attracted to them and seeking a romantic involvement.
Infatuation: Perhaps, this is Sternberg’s version of “love at first sight”. Infatuation consists of an immediate, intense physical attraction to someone. A person who is infatuated finds it hard to think of anything but the other person. Brief encounters are played over and over in one’s head; it may be difficult to eat and there may be a rather constant state of arousal. Infatuation is rather short-lived, however, lasting perhaps only a matter of months or as long as a year or so. It tends to be based on physical attraction and an image of what one “thinks” the other is all about.
Fatuous Love: However, some people who have a strong physical attraction push for commitment early in the relationship. Passion and commitment are aspects of fatuous love. There is no intimacy and the commitment is premature. Partners rarely talk seriously or share their ideas. They focus on their intense physical attraction and yet one, or both, is also talking of making a lasting commitment. Sometimes this is out of a sense of insecurity and a desire to make sure the partner is locked into the relationship.
Empty Love: This type of love may be found later in a relationship or in a relationship that was formed to meet needs other than intimacy or passion, including financial needs, childrearing assistance, or attaining/maintaining status. Here the partners are committed to staying in the relationship for the children, because of a religious conviction, or because there are no alternatives. However, they do not share ideas or feelings with each other and have no physical attraction for one another.
Romantic Love: Intimacy and passion are components of romantic love, but there is no commitment. The partners spend much time with one another and enjoy their closeness, but have not made plans to continue. This may be true because they are not in a position to make such commitments or because they are looking for passion and closeness and are afraid it will die out if they commit to one another and start to focus on other kinds of obligations.
Companionate Love: Intimacy and commitment are the hallmarks of companionate love. Partners love and respect one-another and they are committed to staying together. However, their physical attraction may have never been strong or may have just died out over time. Nevertheless, partners are good friends and committed to one another.
Consummate Love: Intimacy, passion, and commitment are present in consummate love. This is often perceived by western cultures as “the ideal” type of love. The couple shares passion; the spark has not died, and the closeness is there. They feel like best friends, as well as lovers, and they are committed to staying together.
7.4.8 Adult Lifestyles
Singlehood: Being single is the most common lifestyle for people in their early 20s, and there has been an increase in the number of adults staying single. In 1960, only about 1 in 10 adults age 25 or older had never been married, in 2012 that had risen to 1 in 5 (Wang & Parker, 2014). While just over half (53%) of unmarried adults say they would eventually like to get married, 32 percent are not sure, and 13 percent do not want to get married. It is projected that by the time current young adults reach their mid-40s and 50s, almost 25% of them may not have married. The U.S. is not the only country to see a rise in the number of single adults.
Table 7.5 lists some of the reasons young adults give for staying single. In addition, adults are marrying later in life, cohabitating, and raising children outside of marriage in greater numbers than in previous generations. Young adults also have other priorities, such as education, and establishing their careers. This may be reflected by changes in attitudes about the importance of marriage. In a recent Pew Research survey of Americans, respondents were asked to indicate which of the following statements came closer to their own views:
“Society is better off if people make marriage and having children a priority”
“Society is just as well off if people have priorities other than marriage and children”
| Have not met the right person | 30% |
| Do not have financial stability | 27% |
| Not ready to settle down | 22% |
| Too young to marry | 22% |
Slightly more adults endorsed the second statement (50%) than those who chose the first (46%), with the remainder either selecting neither, both equally, or not responding (Wang & Parker, 2014). Young adults age 18-29 were more likely to endorse this view than adults age 30 to 49; 67 percent and 53 percent respectively. In contrast, those age 50 or older were more likely to endorse the first statement (53 percent).
Hooking Up: United States demographic changes have significantly affected the romantic relationships among emerging and early adults. As previously described, the age for puberty has declined, while the times for one’s first marriage and first child have been pushed to older ages. This results in a “historically unprecedented time gap where young adults are physiologically able to reproduce, but not psychologically or socially ready to settle down and begin a family and child rearing,” (Garcia, Reiber, Massey, & Merriwether, 2012, p. 172). Consequently, according to Bogle (2007, 2008) traditional forms of dating have shifted to more casual hookups that involve uncommitted sexual encounters.
Even though most research on hooking up involves college students, 70% of sexually active 12-21 year olds reported having had uncommitted sex during the past year (Grello, Welsh, Harper, & Dickson, 2003). Additionally, Manning, Giordano and Longmore (2006) found that 61% of sexually active seventh, ninth, and eleventh graders reported being involved in a sexual encounter outside of a dating relationship.
Friends with Benefits: Hookups are different than those relationships that involve continued mutual exchange. These relationships are often referred to as Friends with Benefits (FWB) or “Booty Calls.” These relationships involve friends having casual sex without commitment. Hookups do not include a friendship relationship. Bisson and Levine (2009) found that 60% of 125 undergraduates reported a FWB relationship. The concern with FWB is that one partner may feel more romantically invested than the other (Garcia et al., 2012).
Hooking up Gender Differences: When asked about their motivation for hooking up, both males and females indicated physical gratification, emotional gratification, and a desire to initiate a romantic relationship as reasons (Garcia & Reiber, 2008). Although males and females are more similar than different in their sexual behaviors, a consistent finding among the research is that males demonstrate a greater permissiveness to casual sex (Oliver & Hyde, 1993). In another study involving 16,288 individuals across 52 nations, males reported a greater desire of sexual partner variety than females, regardless of relationship status or sexual orientation (Schmitt et al., 2003). This difference can be attributed to gender role expectations for both males and females regarding sexual promiscuity. Additionally, the risks of sexual behavior are higher for females and include unplanned pregnancy, increased sexually transmitted diseases, and susceptibility to sexual violence (Garcia et al., 2012).
Although hooking up relationships have become normalized for emerging adults, some research indicates that the majority of both sexes would prefer a more traditional romantic relationship (Garcia et al., 2012). Additionally, Owen and Fincham (2011) surveyed 500 college students with experience with hookups, and 65% of women and 45% of men reported that they hoped their hookup encounter would turn into a committed relationship. Further, 51% of women and 42% of men reported that they tried to discuss the possibility of starting a relationship with their hookup partner. Casual sex has also been reported to be the norm among gay men, but they too indicate a desire for romantic and companionate relationships (Clarke & Nichols, 1972).
Emotional Consequences of Hooking up: Concerns regarding hooking up behavior certainly are evident in the research literature. One significant finding is the high comorbidity of hooking up and substance use. Those engaging in non-monogamous sex are more likely to have used marijuana, cocaine, and alcohol, and the overall risks of sexual activity are drastically increased with the addition of alcohol and drugs (Garcia et al., 2012). Regret has also been expressed, and those who had the most regret after hooking up also had more symptoms of depression (Welsh, Grello, & Harper, 2006). Hook ups were also found to lower self-esteem, increase guilt, and foster feelings of using someone or feeling used. Females displayed more negative reactions than males, and this may be due to females identifying more emotional involvement in sexual encounters than males.
Hooking up can best be explained by a biological, psychological, and social perspective. Research indicates that emerging adults feel it is necessary to engage in hooking up behavior as part of the sexual script depicted in the culture and media. Additionally, they desire sexual gratification. However, they also want a more committed romantic relationship and may feel regret with uncommitted sex.
Online Dating: The ways people are finding love has changed with the advent of the Internet. Nearly 50 million Americans have tried an online dating website or mobile app (Bryant & Sheldon, 2017). Online dating has also increased dramatically among those age 18 to 24. Today, one in five emerging adults report using a mobile dating app, while in 2013 only 5% did, and 27% report having used online dating, almost triple the rate in 2013 (Smith & Anderson, 2016).
According to a recent survey of couples who met online versus offline (Brown, 2019), those who met online tended to have slightly different levels of education, and political views from their partners, but, the biggest difference was that they were much more likely to come from different racial and ethnic backgrounds (see Figure 7.27). This is not surprising as the average age of the couples who met online was 36, while the average age of couple who met offline was 51. Young adults are more likely to a relationship with people who are different from them, regardless of how they met.
As Finkel, Burnette, and Scissors (2007) found, social networking sites and the Internet perform three important tasks. Specifically, sites provide individuals with access to a database of other individuals who are interested in meeting someone. Dating sites generally reduce issues of proximity, as individuals do not have to be close in proximity to meet. Also, they provide a medium in which individuals can communicate with others. Finally, some Internet dating websites advertise special matching strategies, based on factors such as personality, hobbies, and interests, to identify the “perfect match” for people looking for love online. Social networking sites have provided opportunities for meeting others you would not have normally met. However, social networking sites can also be forums for unsuspecting people to be duped, as the person may not be who he or she says.
Online communication differs from face-to-face interaction in a number of ways. In face-to-face meetings, people have many cues upon which to base their first impressions. A person’s looks, voice, mannerisms, dress, scent, and surroundings all provide information in face-to-face meetings, but in computer-mediated meetings, written messages are the only cues provided. Fantasy is used to conjure up images of voice, physical appearance, mannerisms, and so forth. The anonymity of online involvement makes it easier to become intimate without fear of interdependence. When online, people tend to disclose more intimate details about themselves more quickly. A shy person can open up without worrying about whether or not the partner is frowning or looking away. Someone who has been abused may feel safer in virtual relationships. It is easier to tell one’s secrets because there is little fear of loss. One can find a virtual partner who is warm, accepting, and undemanding (Gwinnell, 1998), and exchanges can be focused more on emotional attraction than physical appearance.
To evaluate what individuals are looking for online, Menkin, Robles, Wiley and Gonzaga (2015) reviewed data from an eHarmony.com relationship questionnaire completed by a cross-sectional representation of 5,434 new users. Their results indicated that users consistently valued communication and characteristics, such as personality and kindness over sexual attraction. Females valued communication over sexual attraction, even more when compared to males, and older users rated sexual attraction as less important than younger users. Alterovitz and Mendelsohn (2011) analyzed 600 Internet personal ads across the lifespan and found that men sought physical attractiveness and offered status related information more than women, while women were more selective than men and sought status more than men. These findings were consistent with previous research on gender differences regarding the importance of physical/sexual attraction.
Catfishing and other forms of scamming is an increasing concern for those who use dating and social media sites and apps. Catfishing refers to “a deceptive activity involving the creation of a fake online profile for deceptive purposes” (Smith, Smith, & Blazka, 2017, p. 33). Notre Dame University linebacker Manti Ta’o fell victim to a catfishing scam. The young woman “Kekua” who he had struck up an online relationship with was a hoax, and he was not the first person to have been scammed by this fictitious woman. A number of US states have passed legislation to address online impersonation, from stealing the information and creating a fake account of a real person to the creation of a fictitious persona with the intent to defraud or harm others (National Conference of State Legislatures, 2017).
Cohabitation: In American society, as well as in a number of other cultures, cohabitation has become increasingly commonplace (Gurrentz, 2018). For many emerging adults, cohabitation has become more commonplace than marriage, as can be seen in Figures 7.28. While marriage is still a more common living arrangement for those 25-34, cohabitation has increased, while marriage has declined, as can be seen in Figure 7.29. Gurrentz also found that cohabitation varies by socioeconomic status. Those who are married tend to have higher levels of education, and thus higher earnings, or earning potential.
Copen, Daniels, and Mosher (2013) found that from 1995 to 2010 the median length of the cohabitation relationship had increased regardless of whether the relationship resulted in marriage, remained intact, or had since dissolved. In 1995 the median length of the cohabitation relationship was 13 months, whereas it was 22 months by 2010. Cohabitation for all racial/ethnic groups, except for Asian women increased between 1995 and 2010 (see Table 7.7). Forty percent of the cohabitations transitioned into marriage within three years, 32% were still cohabitating, and 27% of cohabitating relationships had dissolved within the three years.
| Race/Ethnicity | 1995 | 2006-2010 |
| Hispanic | 30% | 47% |
| White | 35% | 49% |
| Black | 35% | 49% |
| Asian | 22% | 22% |
Three explanations have been given for the rise of cohabitation in Western cultures. The first notes that the increase in individualism and secularism, and the resulting decline in religious observance, has led to greater acceptance and adoption of cohabitation (Lesthaeghe & Surkyn, 1988). Moreover, the more people view cohabitating couples, the more normal this relationship becomes, and the more couples who will then cohabitate. Thus, cohabitation is both a cause and the effect of greater cohabitation.
A second explanation focuses on the economic changes. The growth of industry and the modernization of many cultures has improved women’s social status, leading to greater gender
equality and sexual freedom, with marriage no longer being the only long-term relationship option (Bumpass, 1990). A final explanation suggests that the change in employment requirements, with many jobs now requiring more advanced education, has led to a competition between marriage and pursuing post-secondary education (Yu & Xie, 2015). This might account for the increase in the age of first marriage in many nations. Taken together, the greater acceptance of premarital sex, and the economic and educational changes would lead to a transition in relationships. Overall, cohabitation may become a step in the courtship process or may, for some, replace marriage altogether.
Similar increases in cohabitation have also occurred in other industrialized countries. For example, rates are high in Great Britain, Australia, Sweden, Denmark, and Finland. In fact, more children in Sweden are born to cohabiting couples than to married couples. The lowest rates of cohabitation in industrialized countries are in Ireland, Italy, and Japan (Benokraitis, 2005).
Cohabitation in Non-Western Cultures, The Philippines and China: Similar to other nations, young people in the Philippines are more likely to delay marriage, to cohabitate, and to engage in premarital sex as compared to previous generations (Williams, Kabamalan, & Ogena, 2007). Despite these changes, many young people are still not in favor of these practices. Moreover, there is still a persistence of traditional gender norms as there are stark differences in the acceptance of sexual behavior out of wedlock for men and women in Philippine society. Young men are given greater freedom. In China, young adults are cohabitating in higher numbers than in the past (Yu & Xie, 2015). Unlike many Western cultures, in China adults with higher, rather than lower, levels of education are more likely to cohabitate. Yu and Xie suggest this may be due to seeing cohabitation as being a more “innovative” behavior and that those who are more highly educated may have had more exposure to Western culture.
Marriage Worldwide: Cohen (2013) reviewed data assessing most of the world’s countries and found that marriage has declined universally during the last several decades. This decline has occurred in both poor and rich countries, however, the countries with the biggest drops in marriage were mostly rich: France, Italy, Germany, Japan and the U.S. Cohen states that the decline is not only due to individuals delaying marriage, but also because of high rates of non-marital cohabitation. Delayed or reduced marriage is associated with higher income and lower fertility rates that are reflected worldwide.
Marriage in the United States: In 1960, 72% of adults age 18 or older were married, in 2010 this had dropped to barely half (Wang & Taylor, 2011). At the same time, the age of first marriage has been increasing for both men and women. In 1960, the average age for first marriage was 20 for women and 23 for men. By 2010 this had increased to 26.5 for women and nearly 29 for men (see Figure 7.30). Many of the explanations for increases in singlehood and cohabitation previously given can also account for the drop and delay in marriage.
Same-Sex Marriage: In June 26, 2015, the United States Supreme Court ruled that the Constitution guarantees same-sex marriage. The decision indicated that limiting marriage to only heterosexual couples violated the 14th amendment’s guarantee of equal protection under the law. This ruling occurred 11 years after same-sex marriage was first made legal in Massachusetts, and at the time of the high court decision, 36 states and the District of Columbia had legalized same sex marriage. Worldwide, 29 countries currently have national laws allowing gays and lesbians to marry (Pew Research Center, 2019). As can be seen in Table 7.8, these countries are located mostly in Europe and the Americas.
| Country | Year |
|---|---|
| Argentina | 2010 |
| Australia | 2017 |
| Austria | 2019 |
| Belgium | 2003 |
| Brazil | 2013 |
| Canada | 2005 |
| Colombia | 2016 |
| Denmark | 2012 |
| Ecuador | 2019 |
| England / Wales | 2013 |
| Finland | 2015 |
| France | 2013 |
| Germany | 2017 |
| Greenland | 2015 |
| Iceland | 2010 |
| Ireland | 2015 |
| Luxembourg | 2014 |
| Malta | 2017 |
| Mexico* | 2009 |
| The Netherlands | 2000 |
| New Zealand | 2013 |
| Norway | 2009 |
| Portugal | 2010 |
| Scotland | 2014 |
| South Africa | 2006 |
| Spain | 2005 |
| Sweden | 2009 |
| Taiwan | 2019 |
| United States | 2015 |
| Uruguay | 2013 |
*Countries Where Gay Marriage is Legal in Some Jurisdictions
Cultural Influences on Marriage: Many cultures have both explicit and unstated rules that specify who is an appropriate mate. Consequently, mate selection is not completely left to the individual. Rules of endogamy indicate the groups we should marry within and those we should not marry in (Witt, 2009). For example, many cultures specify that people marry within their own race, social class, age group, or religion. Endogamy reinforces the cohesiveness of the group. Additionally, these rules encourage homogamy or marriage between people who share social characteristics. The majority of marriages in the U. S. are homogamous with respect to race, social class, age and to a lesser extent, religion. Homogamy is also seen in couples with similar personalities and interests.
Arranged Marriages and Elopement: Historically, marriage was not a personal choice, but one made by one’s family. Arranged marriages often ensured proper transference of a family’s wealth and the support of ethnic and religious customs. Such marriages were a marriage of families rather than of individuals. In Western Europe, starting in the 18th century the notion of personal choice in a marital partner slowly became the norm. Arranged marriages were seen as “traditional” and marriages based on love “modern”. Many of these early “love” marriages were obtained by eloping (Thornton, 2005).
Around the world, more and more young couples are choosing their partners, even in nations where arranged marriages are still the norm, such as India and Pakistan. Desai and Andrist (2010) found that only 5% of the women they surveyed, aged 25-49, had a primary role in choosing their partner. Only 22% knew their partner for more than one month before they were married. However, the younger cohort of women was more likely to have been consulted by their families before their partner was chosen than were the older cohort, suggesting that family views are changing about personal choice. Allendorf (2013) reports that this 5% figure may also underestimate young people’s choice, as only women were surveyed. Many families in India are increasingly allowing sons veto power over the parents’ choice of his future spouse, and some families give daughters the same say.
Marital Arrangements in India: As the number of arranged marriages in India is declining, elopement is increasing. Allendorf’s (2013) study of a rural village in India, describes the elopement process. In many cases the female leaves her family home and goes to the male’s home, where she stays with him and his parents. After a few days, a member of his family will inform her family of her whereabouts and gain consent for the marriage. In other cases, where the couple anticipate some degree of opposition to the union, the couple may run away without the knowledge of either family, often going to a relative of the male. After a few days, the couple comes back to the home of his parents, where at that point consent is sought from both families. Although, in some cases families may sever all ties with their child or encourage him or her to abandon the relationship, typically, they agree to the union as the couple have spent time together overnight. Once consent has been given, the couple lives with his family and are considered married. A more formal ceremony takes place a few weeks or months later.
Arranged marriages are less common in the more urban regions of India than they are outside of the cities. In rural regions, often the family farm is the young person’s only means of employment. Thus, going against family choices may carry bigger consequences. Young people who live in urban centers have more employment options. As a result, they are often less economically dependent on their families, and may feel freer to make their own choices. Thornton (2005) suggests these changes are also being driven by mass media, international travel, and general Westernization of ideas. Besides India, China, Nepal, and several nations in Southeast Asia have seen a decline in the number of arranged marriages, and an increase in elopement or couples choosing their own partners with their families’ blessings (Allendorf, 2013).
Predictors of Marital Harmony: Advice on how to improve one’s marriage is centuries old. One of today’s experts on marital communication is John Gottman. Gottman (1999) differs from many marriage counselors in his belief that having a good marriage does not depend on compatibility. Rather, the way that partners communicate to one another is crucial. At the University of Washington in Seattle, Gottman has measured the physiological responses of thousands of couples as they discuss issues of disagreement. Fidgeting in one’s chair, leaning closer to or further away from the partner while speaking, and increases in respiration and heart rate are all recorded and analyzed along with videotaped recordings of the partners’ exchanges. Gottman believes he can accurately predict whether or not a couple will stay together by analyzing their communication. In marriages destined to fail, partners engage in the “marriage killers”: Contempt, criticism, defensiveness, and stonewalling. Each of these undermines the politeness and respect that healthy marriages require. Stonewalling, or shutting someone out, is the strongest sign that a relationship is destined to fail.
Gottman, Carrere, Buehlman, Coan, and Ruckstuhl (2000) researched the perceptions newlyweds had about their partner and marriage. The Oral History Interview used in the study, which looks at eight variables in marriage including: Fondness/affection, we-ness, expansiveness/ expressiveness, negativity, disappointment, and three aspects of conflict resolution (chaos, volatility, glorifying the struggle), was able to predict the stability of the marriage with 87% accuracy at the four to six year-point and 81% accuracy at the seven to nine year-point. Gottman (1999) developed workshops for couples to strengthen their marriages based on the results of the Oral History Interview. Interventions include increasing the positive regard for each other, strengthening their friendship, and improving communication and conflict resolution patterns.
Accumulated Positive Deposits: When there is a positive balance of relationship deposits this can help the overall relationship in times of conflict. For instance, some research indicates that a husband’s level of enthusiasm in everyday marital interactions was related to a wife’s affection in the midst of conflict (Driver & Gottman, 2004), showing that being pleasant and making deposits can change the nature of conflict. Also, Gottman and Levenson (1992) found that couples rated as having more pleasant interactions, compared with couples with less pleasant interactions, reported marital problems as less severe, higher marital satisfaction, better physical health, and less risk for divorce. Finally, Janicki, Kamarck, Shiffman, and Gwaltney (2006) showed that the intensity of conflict with a spouse predicted marital satisfaction, unless there was a record of positive partner interactions, in which case the conflict did not matter as much. Again, it seems as though having a positive balance through prior positive deposits helps to keep relationships strong even in the midst of conflict.
7.4.9 Intimate Partner Abuse
Violence in romantic relationships is a significant concern for women in early adulthood as females aged 18 to 34 generally experience the highest rates of intimate partner violence. According to the most recent Violence Policy Center (2018) study, more than 1,800 women were murdered by men in 2016. The study found that nationwide, 93% of women killed by men were murdered by someone they knew, and guns were the most common weapon used. The national rate of women murdered by men in single victim/single offender incidents dropped 24%, from 1.57 per 100,000 in 1996 to 1.20 per 100,000 in 2016. However, since reaching a low of 1.08 per 100,000 women in 2014, the 2016 rate increased 11%.
Intimate partner violence is often divided into situational couple violence, which is the violence that results when heated conflict escalates, and intimate terrorism, in which one partner consistently uses fear and violence to dominate the other (Bosson, et al., 2019). Men and women equally use and experience situational couple violence, while men are more likely to use intimate terrorism than are women. Consistent with this, a national survey described below, found that female victims of intimate partner violence experience different patterns of violence, such as rape, severe physical violence, and stalking than male victims, who most often experienced more slapping, shoving, and pushing.
The last National Intimate Partner and Sexual Violence Survey (NISVS) was conducted in 2015 (Smith et al., 2018). The NISVS examines the prevalence of intimate partner violence, sexual violence, and stalking among women and men in the United States over the respondent’s lifetime and during the 12 months before the interview. A total of 5,758 women and 4,323 men completed the survey. Based on the results, women are disproportionately affected by intimate partner violence, sexual violence, and stalking. Results included:
Nearly 1 in 3 women and 1 in 6 men experienced some form of contact sexual violence during their lifetime.
Nearly 1 in 5 women and 1 in 39 men have been raped in their lifetime.
Approximately 1 in 6 women and 1 in 10 men experienced sexual coercion (e.g., sexual pressure from someone in authority, or being worn down by requests for sex).
Almost 1 in 5 women have been the victim of severe physical violence by an intimate partner, while 1 in 7 men have experienced the same.
1 in 6 women have been stalked during their lifetime, compared to 1 in 19 men.
More than 1 in 4 women and more than 1 in 10 men have experienced contact sexual violence, physical violence, or stalking by an intimate partner and reported significant short- or long-term impacts, such as post-traumatic stress disorder symptoms and injury.
An estimated 1 in 3 women experienced at least one act of psychological aggression by an intimate partner during their lifetime.
Men and women who experienced these forms of violence were more likely to report frequent headaches, chronic pain, difficulty with sleeping, activity limitations, poor physical health, and poor mental health than men and women who did not experience these forms of violence.

7.4.10 Parenthood
Parenthood is undergoing changes in the United States and elsewhere in the world. Children are less likely to be living with both parents, and women in the United States have fewer children than they did previously. The average fertility rate of women in the United States was about seven children in the early 1900s and has remained relatively stable at 2.1 since the 1970s (Hamilton, Martin, & Ventura, 2011; Martinez, Daniels, & Chandra, 2012). Not only are parents having fewer children, the context of parenthood has also changed. Parenting outside of marriage has increased dramatically among most socioeconomic, racial, and ethnic groups, although college-educated women are substantially more likely to be married at the birth of a child than are mothers with less education (Dye, 2010).
People are having children at older ages, too. This is not surprising given that many of the age markers for adulthood have been delayed, including marriage, completing education, establishing oneself at work, and gaining financial independence. In 2014 the average age for American first-time mothers was 26.3 years (CDC, 2015a). The birth rate for women in their early 20s has declined in recent years, while the birth rate for women in their late 30s has risen. In 2011, 40% of births were to women ages 30 and older. For Canadian women, birth rates are even higher for women in their late 30s than in their early 20s. In 2011, 52% of births were to women ages 30 and older, and the average first-time Canadian mother was 28.5 years old (Cohn, 2013). Improved birth control methods have also enabled women to postpone motherhood. Despite the fact that young people are more often delaying childbearing, most 18- to 29-year-olds want to have children and say that being a good parent is one of the most important things in life (Wang & Taylor, 2011).
Influences on Parenting: Parenting is a complex process in which parents and children influence on another. There are many reasons that parents behave the way they do. The multiple influences on parenting are still being explored. Proposed influences on parenting include: Parent characteristics, child characteristics, and contextual can sociocultural characteristics. (Belsky, 1984; Demick, 1999).
Parent Characteristics: Parents bring unique traits and qualities to the parenting relationship that affect their decisions as parents. These characteristics include the age of the parent, gender, beliefs, personality, developmental history, knowledge about parenting and child development, and mental and physical health. Parents’ personalities affect parenting behaviors. Mothers and fathers who are more agreeable, conscientious, and outgoing are warmer and provide more structure to their children. Parents who are more agreeable, less anxious, and less negative also support their children’s autonomy more than parents who are anxious and less agreeable (Prinzie, Stams, Dekovic, Reijntes, & Belsky, 2009). Parents who have these personality traits appear to be better able to respond to their children positively and provide a more consistent, structured environment for their children.
Parents’ developmental histories, or their experiences as children, also affect their parenting strategies. Parents may learn parenting practices from their own parents. Fathers whose own parents provided monitoring, consistent and age-appropriate discipline, and warmth were more likely to provide this constructive parenting to their own children (Kerr, Capaldi, Pears, & Owen, 2009). Patterns of negative parenting and ineffective discipline also appear from one generation to the next. However, parents who are dissatisfied with their own parents’ approach may be more likely to change their parenting methods with their own children.
Child Characteristics: Parenting is bidirectional. Not only do parents affect their children, children influence their parents. Child characteristics, such as gender, birth order, temperament, and health status, affect parenting behaviors and roles. For example, an infant with an easy temperament may enable parents to feel more effective, as they are easily able to soothe the child and elicit smiling and cooing. On the other hand, a cranky or fussy infant elicits fewer positive reactions from his or her parents and may result in parents feeling less effective in the parenting role (Eisenberg et al., 2008). Over time, parents of more difficult children may become more punitive and less patient with their children (Clark, Kochanska, & Ready, 2000; Eisenberg et al., 1999; Kiff, Lengua, & Zalewski, 2011). Parents who have a fussy, difficult child are less satisfied with their marriages and have greater challenges in balancing work and family roles (Hyde, Else-Quest, & Goldsmith, 2004). Thus, child temperament, as previously discussed in chapter 3, is one of the child characteristics that influences how parents behave with their children.
Another child characteristic is the gender of the child. Parents respond differently to boys and girls. Parents often assign different household chores to their sons and daughters. Girls are more often responsible for caring for younger siblings and household chores, whereas boys are more likely to be asked to perform chores outside the home, such as mowing the lawn (Grusec, goodnow, & Cohen, 1996). Parents also talk differently with their sons and daughters, providing more scientific explanations to their sons and using more emotion words with their daughters (Crowley, Callanan, Tenenbaum, & Allen, 2001).
Contextual Factors and Sociocultural Characteristics: The parent–child relationship does not occur in isolation. Sociocultural characteristics, including economic hardship, religion, politics, neighborhoods, schools, and social support, also influence parenting. Parents who experience economic hardship are more easily frustrated, depressed, and sad, and these emotional characteristics affect their parenting skills (Conger & Conger, 2002). Culture also influences parenting behaviors in fundamental ways. Although promoting the development of skills necessary to function effectively in one’s community is a universal goal of parenting, the specific skills necessary vary widely from culture to culture. Thus, parents have different goals for their children that partially depend on their culture (Tamis-LeMonda et al., 2008). Parents vary in how much they emphasize goals for independence and individual achievements, maintaining harmonious relationships, and being embedded in a strong network of social relationships. Other important contextual characteristics, such as the neighborhood, school, and social networks, also affect parenting, even though these settings do not always include both the child and the parent (Brofenbrenner, 1989). Culture is also a contributing contextual factor, as discussed previously in chapter four. For example, Latina mothers who perceived their neighborhood as more dangerous showed less warmth with their children, perhaps because of the greater stress associated with living a threatening environment (Gonzales et al., 2011). The different influences are shown in Figure 7.11.
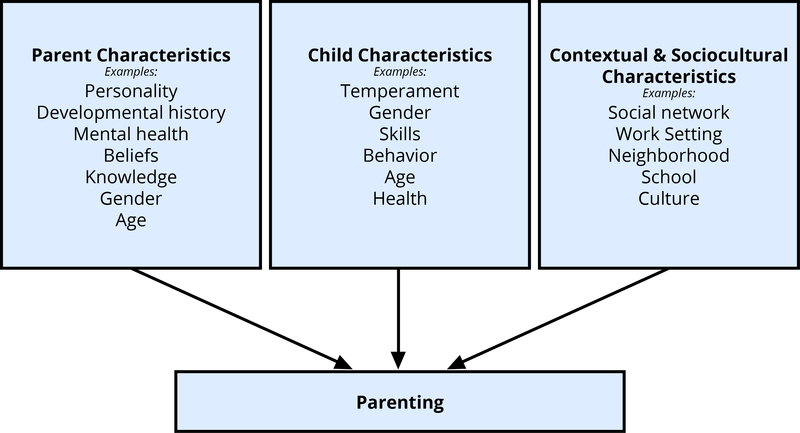
7.5 References
Allendorf, K. (2013). Schemas of marital change: From arranged marriages to eloping for love. Journal of Marriage and Family, 75, 453-469.
Alterovitz, S., & Mendelsohn, G. A. (2011). Partner preferences across the life span: Online dating by older adults. Psychology of Popular Media Culture, 1(S), 89-95.
American Psychiatric Association. (2013). Diagnostic and statistical manual of mental disorders (Fifth Edition). Washington, D. C.: Author.
American Psychological Association. (2016). Sexual orientation and homosexuality. Retrieved from http://www.apa.org/topics/lgbt/orientation.aspx
Arnett, J. J. (2000). Emerging adulthood: A theory of development from late teens through the twenties. American Psychologist, 55, 469-480.
Arnett, J. J. (2001). Conceptions of the transitions to adulthood: Perspectives from adolescence to midlife. Journal of Adult Development, 8, 133-143.
Arnett, J. J. (2003). Conceptions of the transition to adulthood among emerging adults in American ethnic groups. New Directions for Child and Adolescent Development, 100, 63–75.
Arnett, J. J. (2004). Conceptions of the transition to adulthood among emerging adults in American ethnic groups. In J. J. Arnett & N. Galambos (Eds.), Cultural conceptions of the transition to adulthood: New directions in child and adolescent development. San Francisco: Jossey-Bass.
Arnett, J. J. (2006). G. Stanley Hall’s adolescence: Brilliance and non-sense. History of Psychology, 9, 186-197.
Arnett, J.J. (2007). The long and leisurely route: Coming of age in Europe today. Current History, 106, 130-136.
Arnett, J. J. (2011). Emerging adulthood(s): The cultural psychology of a new life stage. In L.A. Jensen (Ed.), Bridging cultural and developmental psychology: New syntheses in theory, research, and policy (pp. 255–275). New York, NY: Oxford University Press.
Arnett, J. J. (2016). Does emerging adulthood theory apply across social classes? National data on a persistent question. Emerging Adulthood, 4(4), 227-235.
Arnett, J. J., & Taber, S. (1994). Adolescence terminable and interminable: When does adolescence end? Journal of Youth and Adolescence, 23, 517–537.
Aquilino, W. S. (2006). Family relationships and support systems in emerging adulthood. In J. J. Arnett & J. L. Tanner (Eds.), Emerging adults in America: Coming of age in the 21st century (pp. 193-217). Washington, DC: American Psychological Association.
Babcock, L., Gelfand, M., Small, D., & Stayn, H. (2006). Gender differences in the propensity to initiate negotiations. In D. De Cremer, M. Zelenberg, & J.K. Muringham (Eds.), Social psychology and economics (pp. 239-262). Mahwah, NJ: Lawrence Erlbaum.
Back, M. D., Schmukle, S. C., & Egloff, B. (2008). Becoming friends by chance. Psychological Science, 19(5), 439–440.
Bailey, J. M., & Pillard, R. C. (1991). A genetic study of male sexual orientation. Archives of General Psychiatry, 48, 1089-1096.
Bailey, J. M., Pillard, R. C., Neale, M. C. & Agyei, Y. (1993). Heritable factors influence sexual orientation in women. Archives of General Psychology, 50, 217-223.
Baldridge, D.C., Eddleston, K.A., & Vega, J.F. (2006). Saying no to being uprooted: The impact of family and gender on willingness to relocate. Journal of Occupational and Organizational Psychology, 79, 131-149.
Balthazart, J. (2018). Fraternal birth order effect on sexual orientation explained. Proceedings of the National Academy of Sciences of the United States of America, 115(2), 234-236.
Bartholomew, K. (1990). Avoidance of intimacy: An attachment perspective. Journal of Social and Personal Relationships, 7, 147-178. DOI: 10.1037/0022-3524.61.2.226.
Basseches, M. (1984). Dialectical thinking and adult development. Norwood, NJ: Ablex Pub.
Bauermeister, J. A., Johns, M. M., Sandfort, T. G., Eisenberg, A., Grossman, A. H., & D’Augelli, A. R. (2010). Relationship trajectories and psychological well-being among sexual minority youth. Journal of Youth and Adolescence, 39(10), 1148-1163.
Belsky, J. (1984). The determinants of parenting: A process model. Child Development, 55, 83–96.
Benokraitis, N. V. (2005). Marriages and families: Changes, choices, and constraints (5th ed.). Upper Saddle River, NJ: Pearson.
Berger, K. S. (2005). The developing person through the life span (6th ed.). New York: Worth.
Bisson, M. A., & Levine, T. R. (2009). Negotiating a friends with benefits relationship. Archives of Sexual Behavior, 38, 66–73. doi:10.1007/s10508-007-9211-2
Blanchard, R. (2001). Fraternal birth order and the maternal immune hypothesis of male homosexuality. Hormones and Behavior, 40, 105-114.
Blau, F. D., Ferber, M. A., & Winkler, A. E. (2010). The economics of women, men and work. (6th ed.). Boston, MA: Prentice Hall.
Bogaert, A. F. (2015). Asexuality: What it is and why it matters. Journal of Sex Research, 52(4), 362-379. doi:10.1080/00224499.2015.1015713
Bogle, K. A. (2007). The shift from dating to hooking up in college: What scholars have missed. Sociology Compass, 1/2, 775–788.
Bogle, K. A. (2008). Hooking up: Sex, dating, and relationships on campus. New York, NY: New York University Press.
Bohlin, G., & Hagekull, B. (2009). Socio-emotional development from infancy to young adulthood. Scandinavian Journal of Psychology, 50, 592-601.
Borgogna, N. C., McDermott, R. C., Aita, S. L., & Kridel, M. M. (2019). Anxiety and depression across gender and sexual minorities: Implications for transgender, gender nonconforming, pansexual, demisexual, asexual, queer and questioning individuals. Psychology of Sexual Orientation and Gender Diversity, 6(1), 54-63.
Bosson, J. K., Vandello, J., & Buckner, C. (2019). The psychology of sex and gender. Thousand Oaks, CA: Sage.
Boundless. (2016). Physical development in adulthood. Boundles Psychology. Retrieved from https://www.boundless.com/psychology/textbooks/boundless-psychology-textbook/human-development-14/early-and-middle-adulthood-74/physical-development-in-adulthood-287-12822/
Bronfenbrenner, U. (1989). Ecological systems theory. In R. Vasta (Ed.), Annals of Child Development, Vol. 6 (pp. 187–251). Greenwich, CT: JAI Press.
Brooks-Gunn, J., & Lewis, M. (1981). Infant social perception: Responses to pictures of parents and strangers. Developmental Psychology, 17(5), 647–649.
Brown, A. (2019). Couples who meet online are more diverse than those who meet in other ways, largely because they’reyounger. Pew Research Center. Retrieved from https://www.pewresearch.org/fact-tank/2019/06/24/couples-who-meet-online-are-more-diverse-than-those-who-meet-in-other-ways-largely-because-theyre-younger/
Bruckmuller, S., Ryan, M.K., Floor, R., & Haslam, S.A. (2014). The glass cliff: Examining why women occupy leadership positions in precarious circumstances. In S. Kumra, R. Simpson, & R.J. Burke (Eds.), Oxford handbook of gender in organizations (pp. 314-331). New York: Oxford University Press.
Bryant, K. & Sheldon, P. (2017). Cyber dating in the age of mobile apps: Understanding motives, attitudes, and characteristics of users. American Communication Journal, 19(2), 1-15.
Bumpass, L. L. (1990). What’s happening to the family? Interactions between demographic and institutional change. Demography, 27(4), 483–498.
Butzer, B., & Campbell, L. (2008). Adult attachment, sexual satisfaction, and relationship satisfaction: A study of married couples. Personal Relationships, 15, 141-154.
Cain, S. (2012). Quiet. New York: Crown Publishing Group.
Campbell, L., Simpson, J. A., Boldry, J., & Kashy, D. A. (2005). Perceptions of conflict and support in romantic relationships: The role of attachment anxiety. Journal of Personality and Social Psychology, 88, 510-532.
Carlson, N. R. (2011). Foundations of behavioral neuroscience (8th ed.). Boston, MA: Pearson Education.
Carroll, J. L. (2007). Sexuality now: Embracing diversity (2nd ed.). Belmont, CA: Thomson Learning.
Carroll, J. L. (2016). Sexuality now: Embracing diversity (5th ed.). Boston, MA: Cengage Learning.
Ceci, S. J., & Williams, W. M. (2011). Understanding current causes of women’s under-representation in science. Proceedings of the National Academy of Science of the United States of America, 108(8), 3157-3162. doi:10.1073/pnas.1014871108
Centers for Disease Control and Prevention (2014). Reported STDs in the United States. Retrieved from http://www.cdc.gov/std/stats14/std-trends-508.pdf
Centers for Disease Control and Prevention (2015a). Births and natality. Retrieved from http://www.cdc.gov/nchs/fastats/births.htm
Centers for Disease Control and Prevention. (2015b). Obesity and overweight. Retrieved from http://www.cdc.gov/nchs/fastats/obesity-overweight.htm
Centers for Disease Control and Prevention. (2016). Adult obesity causes and consequences. Retrieved from http://www.cdc.gov/obesity/adult/causes.html
Channick, R. (2019, July 9). Putting gender pay gap onto a broader stage. The Chicago Tribune, pp. 1-2.
Chappell, K. D., & Davis, K. E. (1998). Attachment, partner choice, and perception of romantic partners: An experimental test of the attachment-security hypothesis. Personal Relationships, 5, 327–342.
Chess, S., & Thomas, A. (1987). Origins and evolution of behavior disorders. Cambridge, MA: Harvard University Press.
Chopik, W. J., Edelstein, R. S., & Fraley, R. C. (2013). From the cradle to the grave: Age differences in attachment from early adulthood to old age. Journal or Personality, 81 (2), 171-183 DOI: 10.1111/j. 1467-6494.2012.00793
Cicirelli, V. (2009). Sibling relationships, later life. In D. Carr (Ed.), Encyclopedia of the life course and human development. Boston, MA: Cengage.
Clark, L. A., Kochanska, G., & Ready, R. (2000). Mothers’ personality and its interaction with child temperament as predictors of parenting behavior. Journal of Personality and Social Psychology, 79, 274–285.
Clark, L. A. & Watson, D. (1999). Temperament: A new paradigm for trait theory. In L.A. Pervin & O. P. John (Eds.), Handbook of personality. NY: Guilford.
Clarke, L., & Nichols, J. (1972). I have more fun with you than anybody. New York, NY: St. Martin’s.
Cohen, P. (2013). Marriage is declining globally. Can you say that? Retrieved from https://familyinequality.wordpress.com/2013/06/12/marriage-is-declining/
Cohen-Bendehan, C. C., van de Beek, C. & Berenbaum, S. A. (2005). Prenatal sex hormone effects on child and adult sex-typed behavior: Methods and findings. Neuroscience and Biobehavioral Reviews, 47, 230-237.
Cohn, D. (2013). In Canada, most babies now born to women 30 and older. Pew Research Center.
Conger, R. D., & Conger, K. J. (2002). Resilience in Midwestern families: Selected findings from the first decade of a prospective longitudinal study. Journal of Marriage and Family, 64, 361–373.
Copen, C.E., Daniels, K., & Mosher, W.D. (2013) First premarital cohabitation in the United States: 2006–2010 National Survey of Family Growth. National health statistics reports; no 64. Hyattsville, MD: National Center for Health Statistics.
Council of Economic Advisors. (2015). Gender pay gap: Recent trends and explanations. Retrieved from https://www.whitehouse.gov/sites/default/files/docs/equal_pay_issue_brief_final.pdf
Crowley, K., Callanan, M. A., Tenenbaum, H. R., & Allen, E. (2001). Parents explain more often to boys than to girls during shared scientific thinking. Psychological Science, 12, 258–261.
Davidson, R. J. & Begley, S. (2012). The emotional life of your brain. New York: Penguin.
Davis, J. L., & Rusbult, C. E. (2001). Attitude alignment in close relationships. Journal of Personality & Social Psychology, 81(1), 65–84.
Demick, J. (1999). Parental development: Problem, theory, method, and practice. In R. L. Mosher, D. J. Youngman, & J. M. Day (Eds.), Human development across the life span: Educational and psychological applications (pp. 177–199). Westport, CT: Praeger.
Desai, S., & Andrist, L. (2010). Gender scripts and age at marriage in India. Demography, 47, 667-687. doi:10.1353/dem.0.0118
Desilver, D. (2016) Millions of young people in the US and EU are neither working nor learning. Pew Research Center (January 28, 2016). http://www.pewresearch.org/fact-tank/2016/01/28/us-eu-neet-population/
Diamond, M. (2002). Sex and gender are different: Sexual identity and gender identity are different. Clinical Child Psychology and Psychiatry, 7(3), 320-334.
Douglass, C. B. (2007). From duty to desire: Emerging adulthood in Europe and its consequences. Child Development Perspectives, 1, 101–108.
Driver, J., & Gottman, J. (2004). Daily marital interactions and positive affect during marital conflict among newlywed couples. Family Process, 43, 301–314.
Dunn, J. (1984). Sibling studies and the developmental impact of critical incidents. In P.B. Baltes & O.G. Brim (Eds.), Life-span development and behavior (Vol 6). Orlando, FL: Academic Press.
Dunn, J. (2007). Siblings and socialization. In J. E. Grusec & P. D. Hastings (Eds.), Handbook of socialization. New York: Guilford.
Dye, J. L. (2010). Fertility of American women: 2008. Current Population Reports. Retrieved from www.census.gov/prod/2010pubs/p20-563.pdf.
Ebrahimi, L., Amiri, M., Mohamadlou, M., & Rezapur, R. (2017). Attachment stules, parenting styles, and depression. International Journal of Mental Health, 15, 1064-1068.
Eisenberg, N., Fabes, R. A., Shepard, S. A., Guthrie, I.K., Murphy, B.C., & Reiser, M. (1999). Parental reactions to children’s negative emotions: Longitudinal relations to quality of children’s social functioning. Child Development, 70, 513-534.
Eisenberg, N., Hofer, C., Spinrad, T., Gershoff, E., Valiente, C., Losoya, S. L., Zhou, Q., Cumberland, A., Liew, J., Reiser, M., & Maxon, E. (2008). Understanding parent-adolescent conflict discussions: Concurrent and across-time prediction from youths’ dispositions and parenting. Monographs of the Society for Research in Child Development, 73, (Serial No. 290, No. 2), 1-160.
Erikson, E. H. (1950). Childhood and society. New York: Norton.
Erikson, E. H. (1968). Identity: Youth and crisis. New York: Norton.
Finkel, E. J., Burnette J. L., & Scissors L. E. (2007). Vengefully ever after: Destiny beliefs, state attachment anxiety, and forgiveness. Journal of Personality and Social Psychology, 92, 871–886.
Fraley, R. C. (2013). Attachment through the life course. In R. Biswas-Diener & E. Diener (Eds), Noba textbook series: Psychology. Champaign, IL: DEF publishers. Retrieved from nobaproject.com.
Fraley, R. C., Hudson, N. W., Heffernan, M. E., & Segal, N. (2015). Are adult attachment styles categorical or dimensional? A taxometric analysis of general and relationship-specific attachment orientations. Journal of Personality and Social Psychology, 109 (2), 354-368.
Fraley, R. C., Roisman, G. I., Booth-LaForce, C., Owen, M. T., & Holland, A. S. (2013). Interpersonal and genetic origins of adult attachment styles: A longitudinal study from infancy to early adulthood. Journal of Personality and Social Psychology, 104, 8817-838.
Frazier, P. A, Byer, A. L., Fischer, A. R., Wright, D. M., & DeBord, K. A. (1996). Adult attachment style and partner choice: Correlational and experimental findings. Personal Relationships, 3, 117–136.
Freitas, A. L., Azizian, A., Travers, S., & Berry, S. A. (2005). The evaluative connotation of processing fluency: Inherently positive or moderated by motivational context? Journal of Experimental Social Psychology, 41(6), 636–644.
Frieden, T. (2011, January 14). Morbidity and Mortality Weekly Report for the Centers for Disease Control (United States, Center for Disease Control). Retrieved from http://www.cdc.gov/mmwr/preview/mmwrhtml/su6001al.htm?s_su6001al_w
Friedman, H. S., Tucker, J. S., Tomlinson-Keasey, C., Schwartz, J. E., Wingard, D. L., & Criqui, M. H. (1993). Does childhood personality predict longevity? Journal of Personality and Social Psychology, 65, 176–185. doi:10.1037/0022-3514.65.1.176
Fry, R. (2016). For first time in modern era, living with parents edges out other living arrangements for 18- to 34- year-olds. Washington, D.C.: Pew Research Center.
Fry, R. (2018). Millenials are the largest generation in the U. S. labor force. Retrieved from: https://www.pewresearch.org/fact- tank/2018/04/11/millennials-largest-generation-us-labor-force/
Fryar, C. D., Carroll, M. D., & Ogden, C. L. (2014). Prevalence of overweight, obesity, and extreme obesity among adults: United States, 1960-1962 through 2011-2012. Retrieved from http://www.cdc.gov/nchs/data/hestat/obesity_adult_11_12/obesity_adult_11_12.htm
Gallup Poll Report (2016). What millennials want from work and life. Business Journal. Retrieved from http://www.gallup.com/businessjournal/191435/millennials-work-life.aspx
Garcia, J. R., & Reiber, C. (2008). Hook-up behavior: A biopsychosocial perspective. The Journal of Social, Evolutionary, and Cultural Psychology, 2, 192–208.
Garcia, J. R., Reiber, C., Massey, S. G., & Merriwether, A. M. (2012). Sexual hookup culture: A review. Review of General Psychology, 16(2), 161-176. doi:10.1037/a0027911
Gates, G. J. (2011). How many people are lesbian, gay, bisexual and transgender? Retrieved from http://williamsinstitute.law.ucla.edu/research/census-lgbt-demographics-studies/how-many-people-are-lesbian-gay-bisexual-and-transgender/
Gonzales, N. A., Coxe, S., Roosa, M. W., White, R. M. B., Knight, G. P., Zeiders, K. H., & Saenz, D. (2011). Economic hardship, neighborhood context, and parenting: Prospective effects on Mexican-American adolescent’s mental health. American Journal of Community Psychology, 47, 98–113. doi: 10.1007/s10464-010-9366-1
Gottman, J. M. (1999). Couple’s handbook: Marriage Survival Kit Couple’s Workshop. Seattle, WA: Gottman Institute.
Gottman, J. M., Carrere, S., Buehlman, K. T., Coan, J. A., & Ruckstuhl, L. (2000). Predicting marital stability and divorce in newlywed couples. Journal of Family Psychology, 14(1), 42-58.
Gottman, J. M., & Levenson, R. W. (1992). Marital processes predictive of later dissolution: Behavior, physiology and health. Journal of Personality and Social Psychology, 63, 221–233.
Grello, C. M., Welsh, D. P., Harper, M. S., & Dickson, J. W. (2003). Dating and sexual relationship trajectories and adolescent functioning. Adolescent & Family Health, 3, 103–112.
Grusec, J. E., Goodnow, J. J., & Cohen, L. (1996). Household work and the development of concern for others. Developmental Psychology, 32, 999–1007.
Gurrentz, B. (2018). For young adults, cohabitation is up, and marriage is down. US. Census Bureau. Retrieved from https://www.census.gov/library/stories/2018/11/cohabitaiton-is-up-marriage-is-down-for-young-adults.html.
Gwinnell, E. (1998). Online seductions: Falling in love with strangers on the Internet. New York: Johnson Publishing.
Hales, C.M., Carroll, M.D., Fryar, C.D., & Ogden, C.L. (2017). Prevalence of obesity among adults and youth: United States, 2015–2016. NCHS data brief, no 288. Hyattsville, MD: National Center for Health Statistics.
Hamilton, B. E., Martin, J. A., & Ventura, S. J. (2011). Births: Preliminary data for 2010. National Vital Statistics Reports, 60(2). Hyattsville, MD: U.S. Department of Health and Human Services.
Harmon-Jones, E., & Allen, J. J. B. (2001). The role of affect in the mere exposure effect: Evidence from psychophysiological and individual differences approaches. Personality & Social Psychology Bulletin, 27(7), 889–898.
Harvard Health Letter. (2012). Raising your conscientiousness. Retrieved from http://www.helath.harvard.edu
Hatfield, E., & Rapson, R. L. (2006). Love and sex: Cross-cultural perspectives. New York, NY: University Press of America.
Hazan, C., & Shaver, P. (1987). Romantic love conceptualized as an attachment process. Journal of Personality and Social Psychology, 52 (3), 511-524.
Hegewisch, A., & Ellis, E. (2015). The gender wage gap by occupation 2014 and by race and ethnicity. Washington DC: Institute for Women’s Policy Research. Retrieved from http://www.iwpr.org/publications/pubs/the-gender-wage-gap-by-occupation-2014-and-by-race-and-ethnicity.
Hendrick, C., & Hendrick, S. S. (Eds.). (2000). Close relationships: A sourcebook. Thousand Oaks, CA: Sage.
Heron, M. P., & Smith, B. L. (2007). Products - Health E Stats - Homepage. Centers for Disease Control and Prevention. Retrieved from http://www.cdc.gov/nchs/products/pubs/pubd/hestats/leadingdeath03/leadingdeath03.htm
Hess, A. (2019). Today is the Women’s World Cup final between the US and Netherlands—here’s how much money is on the
line. Retrieved from https://www.cnbc.com/2019/07/04/womens-world-cup-final-how-much-money-is-on-the-line.html
Holland, A. S., Fraley, R. C., & Roisman, G. I. (2012). Attachment styles in dating couples: Predicting relationship functioning
over time. Personal Relationships, 19, 234-246. doi: 10.1111/j.1475-6811.2011.01350.x
Hudson, N. W., Fraley, R. C., Vicary, A. M., & Brumbaugh, C. C. (2012). Attachment coregulation: A longitudinal investigation of the coordination in romantic partners’ attachment styles. Manuscript under review.
Hyde, J. S., Bigler, R., Joel, D., Tate, C., & van Anders, S. (2019). The future of sex and gender in psychology: Five challenges to the gender binary. American Psychologist, 74(2), 171-193.
Hyde, J. S., Else-Quest, N. M., & Goldsmith, H. H. (2004). Children’s temperament and behavior problems predict their employed mothers’ work functioning. Child Development, 75, 580–594.
Institute for College Access & Success. (2018). Student debt and the class of 2017. Retrieved from https://ticas.org/posd/home.
Janicki, D., Kamarck, T., Shiffman, S., & Gwaltney, C. (2006). Application of ecological momentary assessment to the study of marital adjustment and social interactions during daily life. Journal of Family Psychology, 20, 168–172.
John, O. P., Naumann, L. P., & Soto, C. J. (2008). Paradigm shift to the integrative Big Five trait taxonomy: History, measurement, and conceptual issues. In O. P. John, R. R. Robins, & L. A. Pervin (Eds.), Handbook of personality. Theory and research (3rd ed., pp. 114–158). New York, NY: Guilford Press.
John, O. P., Robins, R. W., & Pervin, L. A. (2008). Handbook of personality. Theory and research (3rd ed.). New York, NY: Guilford Press.
Kagan, J. (2002). Behavioral inhibition as a temperamental category. In R.J. Davidson, K. R. Scherer, & H. H. Goldsmith (Eds.), Handbook of affective sciences. New York: Oxford University Press.
Kerr, D. C. R., Capaldi, D. M., Pears, K. C., & Owen, L. D. (2009). A prospective three generational study of fathers’ constructive parenting: Influences from family of origin, adolescent adjustment, and offspring temperament. Developmental Psychology, 45, 1257–1275.
Kiff, C. J., Lengua, L. J., & Zalewski, M. (2011). Nature and nurturing: Parenting in the context of child temperament. Clinical Child and Family Psychology Review, 14, 251–301. doi: 10.1007/s10567011-0093-4
Kinsey, A., Pomeroy, W.B., & Martin, C. E. (1948). Sexual behavior in the human male. Philadelphia, PA: Saunders.
Krebs, C., Lindquist, C., Warner, T., Fisher, B., & Martin, S. (2009). College women’s experiences with physically forced, alcohol or other drug-enabled, and drug-facilitated sexual assault before and since entering college. Journal of American College Health, 57(6), 639-649.
Kreighbaum, A. (2019). Six figures in debt for a master’s degree. Retrieved from https://www.insidehighered.com/news/2019/06/03/updated-college-scorecard-puts-spotlight-graduate-student-borrowing
Laursen, B., & Jensen-Campbell, L. A. (1999). The nature and functions of social exchange in adolescent romantic relationships. In W. Furman, B. B. Brown, & C. Feiring (Eds.), The development of romantic relationships in adolescence (pp. 50–74). New York: Cambridge University Press.
Lesthaeghe, R. J., & Surkyn, J. (1988). Cultural dynamics and economic theories of fertility change. Population and Development Review 14(1), 1–45.
Lucas, R. E. & Donnellan, A. B. (2011). Personality development across the life span: Longitudinal analyses with a national sample from Germany. Journal of Personality and Social Psychology, 101, 847–861
Madden, M. & Lenhart, A. (2006). Americans who are seeking romance use the Internet to help them in their search, but there is still widespread public concern about safety of online dating. Pew/Internet and American Life Project. Retrieved from http://www.pewinternet.org/Reports/2006/OnlineDating.aspx
Mandel, H. (2013). Up the down staircase: Women’s upward mobility and the wage penalty for occupational feminization, 1970-2007. Social Forces, 91, 1183-1207.
Manning, W. S., Giordano, P. C., & Longmore, M. A. (2006). Hooking up: The relationship contexts of “nonrelationship” sex. Journal of Adolescent Research, 21, 459–483. doi:10.1177/0743558406291692
Martinez, G., Daniels, K., & Chandra, A. (2012). Fertility of men and women aged 15-44 years in the United States: National Survey of Family Growth, 2006-2010. National Health Statistics Reports, 51(April). Hyattsville, MD: U.S., Department of Health and Human Services.
McClure, M. J., Lydon., J. E., Baccus, J., & Baldwin, M. W. (2010). A signal detection analysis of the anxiously attached at speed-dating: Being unpopular is only the first part of the problem. Personality and Social Psychology Bulletin, 36, 1024–1036.
Menkin, J. A., Robles, T. F., Wiley, J. F., & Gonzaga, G. C. (2015). Online dating across the life span: Users’ relationship goals. Psychology and Aging, 30(4), 987-993.
Mita, T. H., Dermer, M., & Knight, J. (1977). Reversed facial images and the mere-exposure hypothesis. Journal of Personality & Social Psychology, 35(8), 597–601.
National Center for Transgender Equality. (2015). National transgender discrimination survey. Retrieved from http://www.transequality.org/issues/national-transgender-discrimination-survey
National Conference of State Legislatures. (2017, June). Cyberbullies go catfishing. State Legislatures, 8.
National Institute on Alcohol Abuse and Alcoholism. (2015). College Drinking. Retrieved from http://pubs.niaaa.nih.gov/publications/CollegeFactSheet/CollegeFact.htm
National Institute on Alcohol Abuse and Alcoholism. (2016). Alcohol facts and statistics. Retrieved from http://pubs.niaaa.nih.gov/publications/AlcoholFacts&Stats/AlcoholFacts&Stats.htm
National Institute on Drug Abuse. (2015). College-age and young adults. Retrieved from https://www.drugabuse.gov/related-topics/college-age-young-adults/college-addiction-studies-programs
National Institute of Drug Abuse. (2018). College-age and young adults. Retrieved from https://www.drugabuse.gov/related-topics/college-age-young-adults
NCHEMS. (2016a). Percent of adults 18 to 24 with a high school diploma. National Center for Higher Education Management Systems http://www.higheredinfo.org/dbrowser/?level=nation&mode=graph&state=0&submeasure=344
NCHEMS. (2016b). Percent of adults 18 to 24 who are attending college. National Center for Higher Education Management Systems. Retrieved from: http://www.higheredinfo.org/dbrowser/index.php?submeasure=331&year=2009&level=nation&mode=graph&state=0
NCHEMS. (2016c). Percent of adults 25 to 49 who are attending college. National Center for Higher Education Management Systems. Retrieved from: http://www.higheredinfo.org/dbrowser/index.php?submeasure=332&year=2009&level=nation&mode=graph&state=0
NCHEMS. (2016d). Percent who earn a Bachelor’s degree within 6 years. National Center for Higher Education Management Systems. Retrieved from http://www.higheredinfo.org/dbrowser/?level=nation&mode=graph&state=0&submeasure=27
Nelson, L. J., Badger, S., & Wu, B. (2004). The influence of culture in emerging adulthood: Perspectives of Chinese college students. International Journal of Behavioral Development, 28, 26–36.
Noland, M., Moran, T., & Kotschwar, B. (2016). Is gender diversity profitable? Evidence from a global survey. Washington, DC: Peterson Institute for International Economics. Retrieved from https://www.piie.com/publications/working-papers/gender-diversity-profitable-evidence-global-survey.
OECD. (2014). Education at a Glance 2014: United States, OECD Publishing. Retrieved from https://www.oecd.org/unitedstates/United%20States-EAG2014-Country-Note.pdf
OECD. (2015). Education at a Glance 2015: OECD Indicators, OECD Publishing. Retrieved from http://dx.doi.org/10.1787/eag-2015-en
Office of Adolescent Health. (2019). Prevalence of adolescent opioid misuse. Retrieved from https://www.hhs.gov/ash/oah/adolescent-development/substance-use/drugs/opioids/index.html#prevalence
Oliver, M. B., & Hyde, J. S. (1993). Gender differences in sexuality: A meta-analysis. Psychological Bulletin, 114, 29–51. doi:10.1037/0033-2909.114.1.29
Organisation for Economic Cooperation and Development. (2019). Youth on in employment, education, or training data. Retrieved from https://data.oecd.org/youthinac/youth-not-in-employment-education-or-training-neet.htm
Owen, J., & Fincham, F. D. (2011). Young adults’ emotional reactions after hooking up encounters. Archives of Sexual Behavior, 40, 321–330. doi:10.1007/s10508-010-9652-x
Pascarella, E.T. (2006). How college effects students: Ten directions for future research. Journal of College Student Development, 47, 508-520.
Patton, W. & McMahon, M. (1999). Career development and systems theory: A new relationship. Brooks Cole Publishers.
Peterson, A. (2019, July 9). Women’s World Cup. Changes could go global. The Chicago Tribune, p. 5.
Pew Research Center. (2019). Same-sex marriage around the world. Retrieved from https://www.pewforum.org/fact-sheet/gay-marriage-around-the-world/
Phinney, J. S. & Baldelomar, O. A. (2011). Identity development in multiple cultural contexts. In L. A. Jensen (Ed.), Bridging cultural and developmental psychology: New syntheses in theory, research and policy (pp. 161-186). New York, NY: Oxford University Press.
Potard, C., Courtois, R., & Rusch, E. (2008). The influences of peers on risky behavior during adolescence. European Journal of Contraception and Reproductive Health Care, 13(30, 264-270.
Prinzie, P., Stams, G. J., Dekovic, M., Reijntjes, A. H., & Belsky, J. (2009). The relations between parents’ Big Five personality factors and parenting: A meta-review. Journal of Personality and Social Psychology, 97, 351–362.
Rankin, L. A. & Kenyon, D. B. (2008). Demarcating role transitions as indicators of adulthood in the 21st century. Who are they? Journal of Adult Development, 15(2), 87-92. doi: 10.1007/s10804-007-9035-2
Reis, H. T., & Aron, A. (2008). Love: What is it, why does it matter, and how does it operate? Perspectives on Psychological Science, 3(1), 80–86.
Roberts, B. W., Kuncel, N., Shiner, R., N., Caspi, A., & Goldberg, L. R. (2007). The power of personality: The comparative validity of personality traits, socioeconomic status, and cognitive ability for predicting important life outcomes. Perspectives on Psychological Science, 2(4), 313–345. doi:10.1111/j.1745-6916.2007.00047.
Roberts, B. W., & Mroczek, D. K. (2008). Personality trait change in adulthood. Current Directions in Psychological Science, 17, 31–35.
Rosenberger, N. (2007). Rethinking emerging adulthood in Japan: Perspectives from long-term single women. Child Development Perspectives, 1, 92–95.
Rottinghaus, P. J., Coon, K. L., Gaffey, A. R., & Zytowski, D. G. (2007). Thirty-year stability and predictive validity of vocational interests. Journal of Career Assessment, 15 (1), 5-23.
Rudman, L. A. (1998). Self-promotion as a risk factor for women: The costs and benefits of counterstereotypical impression management. Journal of Personality and Social Psychology, 74(3), 629-645.
Ryan, C. L. & Bauman, K. (March 2016). Educational Attainment in the United States: 2015. U.S. Department of Commerce Economics and Statistics Administration. Retrieved from https://www.census.gov/content/dam/Census/library/publications/2016/demo/p20-578.pdf
Ryle, R. (2011). Questioning gender. Los Angeles, CA: Sage Publishing.
Schindler, I., Fagundes, C. P., & Murdock, K. W. (2010). Predictors of romantic relationship formation: Attachment style, prior relationships, and dating goals. Personal Relationships, 17, 97-105.
Schmitt, D. P., Alcalay, L., Allik, J., Ault, L., Austers, I., Bennett, K. L., . . . Zupane`ie`, A. (2003). Universal sex differences in the desire for sexual variety: Tests from 52 nations, 6 continents, and 13 islands. Journal of Personality and Social Psychology, 85, 85–104. doi:10.1037/ 0022-3514.85.1.85
Schwartz, G., Kim, R., Kolundzija, A., Rieger, G., & Sanders, A. (2010). Biodemographic and physical correlates of sexual orientation in men. Archives of Sexual Behavior, 39, 93-109.
Simpson, J. A., Collins, W. A., Tran, S., & Haydon, K. C. (2007). Attachment and the experience and expression of emotions in adult romantic relationships: A developmental perspective. Journal of Personality and Social Psychology, 92, 355–367.
Simpson, J. A., Rholes, W. S., Oriña, M. M., & Grich, J. (2002). Working models of attachment, support giving, and support seeking in a stressful situation. Personality and Social Psychology Bulletin, 28, 598-608.
Sinnott, J. D. (1998). The development of logic in adulthood. NY: Plenum Press.
Smith, A., & Anderson, M. (2016). 5 facts about online dating. Pew Research Center. Retrieved from http://www.pewresearch.org/fact-tank/2016/02/29/5-facts-about-online-dating
Smith, S., Zhang, X., Basile, K., Merrick, M., Wang, J., Kresnow, M., & Chen, J. (2018). National Intimate Partner and Sexual Violence Survey, United States, 2015. Retrieved from: https://www.cdc.gov/violenceprevention/pdf/2015data-brief508.pdf
Society for the Study of Emerging Adulthood (SSEA). (2016). Overview. Retrieved from http://ssea.org/about/index.htm
Sternberg, R. (1988). A triangular theory of love. New York: Basic.
Super, D. E. (1980). A life-span life-space approach to career development. Journal of Vocational Behavior, 13, 282-298.
Tamis-LeMonda, C. S., Way, N., Hughes, D., Yoshikawa, H., Kalman, R. K., & Niwa, E. Y. (2008). Parents’ goals for children: The dynamic coexistence of individualism and collectivism in cultures and individuals. Social Development, 17, 183–209. doi:10.1111/j.1467.9507.2007.00419.x
Tannen, D. (1990). You just don’t understand: Women and men in conversation. New York: Morrow.
Thornton, A. (2005). Reading history sideways: The fallacy and enduring impact of the developmental paradigm on family life. Chicago: University of Chicago Press.
TICAS. (2015). Student debt and the class of 2014, The Institute for College Access & Success. Retrieved from http://ticas.org/sites/default/files/pub_files/classof2014.pdf
Tye, M. H. (2006). Social inequality and well-being: Race-related stress, self-esteem, and life satisfaction among African American gay and bisexual men. Dissertation Abstracts International: Section B, 67(4-B), 0419-4217.
UNdata (2010). Gross enrollment ratio in tertiary education. United Nations Statistics Division. Retrieved November 5, 2010, from http://data.un.org/Data.aspx?d=GenderStat&f=inID:68
United Nations Development Programme (UNDP). (2011). Human development report. NY: Oxford University Press.
Untied, A., Orchowski, L., Mastroleo, N., & Gidycz, C. (2012). College students’ social reactions to the victim in a hypothetical sexual assault scenario: The role of victim and perpetrator alcohol use. Violence and Victims, 27(6), 957-972.
U.S. Census Bureau. (2019). Educational attainment in the United States: 2018. Retrieved from https://www.census.gov/data/tables/2018/demo/education-attainment/cps-detailed-tables.html
Violence Policy Center. (2018). More than 1,800 women murdered by men in one year, new study finds. Retrieved from http://vpc.org/press/more-than-1800-women-murdered-by-men-in-one-year-new-study-finds/
Volko, N. D. (2004, September 19). Exploring the Whys of Adolescent Drug Use. (United States, National Institute on Drug Abuse). Retrieved from http://www.drugabuse.gov/NIDA_notes/NNvol19N3/DirRepVol19N3.html
Wang, W., & Parker, K. (2014). Record share of Americans have never married: As values, economics and gender patterns change. Washington, DC: Pew Research Center. http://www.pewsocialtrends.org/files/2014/09/2014-09-24_Never-Married-Americans.pdf
Wang, W., & Taylor, P. (2011). For Millennials, parenthood trumps marriage. Washington, DC: Pew Research Center.
Welsh, D. P., Grello, C. M., & Harper, M. S. (2006). No strings attached: The nature of casual sex in college students. Journal of Sex Research, 43, 255–267. doi:10.1080/00224490609552324
Wighton, K. (2016). World’s obese population hits 640 million, according to largest ever study. Imperial College. Retrieved from http://www3.imperial.ac.uh/newsandeventspggrp/imperialcollege/newssummary/news_311-3-2016-22-34-39
Williams, L., Kabamalan, M., & Ogena, N. (2007). Cohabitation in the Philippines: Attitudes and behaviors among young women and men. Journal of Marriage and Family, 69(5), 1244–1256.
Witt, J. (2009). SOC. New York: McGraw Hill.
World Economic Forum. (2017). Global Gender Gap Report 2017. Retrieved from:
http://reports.weforum.org/global-gender-gap-report-2017/key-findings/
Yu, J., & Xie, Y. (2015). Cohabitation in China: Trends and determinants. Population & Development Review, 41 (4), 607-628.
Zebrowitz, L. A., Bronstad, P. M., & Lee, H. K. (2007). The contribution of face familiarity to ingroup favoritism and stereotyping. Social Cognition, 25(2), 306–338.