8 Middle Adulthood
Middle adulthood, or midlife, refers to the period of the lifespan between early adulthood and late adulthood. Although ages and tasks are culturally defined, the most common age definition is from 40-45 to 60-65. This may be the least studied time of the lifespan, and research on this developmental period is relatively new as many aspects of midlife are still being explored. In the United States, the large Baby Boom cohort (those born between 1946 and 1964) are now midlife adults (and some even late adults) and this has led to increased interest in this developmental stage. We do know that this stage reflects both developmental gains and losses and that there are considerable individual differences, but there is still much to learn about this age group.
8.1 Physical Development in Middle Adulthood
Explain the difference between primary and secondary aging
Describe sensory changes that occur during middle adulthood
Identify health concerns in middle adulthood
Explain what occurs during the climacteric for females and males
Describe sexuality during middle adulthood
Explain the importance of sleep and consequences of sleep deprivation
Describe the importance of exercise and nutrition for optimal health
Describe brain functioning in middle adulthood
Each person experiences age-related physical changes based on many factors: biological factors, such as molecular and cellular changes, and oxidative damage are called primary aging, while aging that occurs due to controllable factors, such as an unhealthy lifestyle including lack of physical exercise and poor diet, is called secondary aging (Busse, 1969). These factors are shown in Figure 8.1
Getting out of shape is not an inevitable part of aging; it is probably due to the fact that middle-aged adults become less physically active and have experienced greater stress. Smoking tobacco, drinking alcohol, poor diet, stress, physical inactivity, and chronic disease, such as diabetes or arthritis, reduce overall health. However, there are things can be done to combat many of these changes by adopting healthier lifestyles.
8.1.1 Physical Changes
Hair: When asked to imagine someone in middle adulthood, we often picture someone with the beginnings of wrinkles and gray or thinning hair. What accounts for these physical changes? Hair color is due to a pigment called melanin which is produced by hair follicles (Martin, 2014). With aging, the hair follicles produce less melanin, and this causes the hair to become gray. Hair color typically starts turning lighter at the temples, but eventually all the hair will become white. For many, graying begins in the 30s, but it is largely determined by your genes. Gray hair occurs earlier in white people and later in Asians.
Genes also determine how much hair remains on your head. Almost everyone has some hair loss with aging, and the rate of hair growth slows with aging. Many hair follicles stop producing new hairs and hair strands become smaller. Men begin showing signs of balding by 30 and some are nearly bald by 60. Male-pattern baldness is related to testosterone and is identified by a receding hairline followed by hair loss at the top of the head. Figure 8.2 shows tennis champion Andre Agassi’s characteristic male-patterned baldness. Women can also develop female-patterned baldness as their hair becomes less dense and the scalp becomes visible (Martin, 2014). Sudden hair loss, however, can be a symptom of a health problem.
Skin: Skin continues to dry out and is prone to more wrinkling, particularly on the sensitive face area. Wrinkles, or creases in the skin, are a normal part of aging. As we get older, our skin dries and loses the underlying layer of fat, so our face no longer appears smooth. Loss of muscle tone and thinning skin can make the face appear flabby or drooping. Although wrinkles are a natural part of aging and genetics plays a role, frequent sun exposure and smoking will cause wrinkles to appear sooner. Dark spots and blotchy skin also occur as one ages and are due to exposure to sunlight (Moskowitz, 2014). Blood vessels become more apparent as the skin continues to dry and get thinner.
Sarcopenia: The loss of muscle mass and strength that occurs with aging is referred to as sarcopenia (Morley, Baumgartner, Roubenoff, Mayer, & Nair, 2001). Sarcopenia is thought to be a significant factor in the frailty and functional impairment that occurs when older. The decline of growth and anabolic hormones, especially testosterone, and decreased physical activity have been implicated as causes of sarcopenia (Proctor, Balagopal, & Nair, 1998). This decline in muscle mass can occur as early as 40 years of age and contributes significantly to a decrease in life quality, increase in health care costs, and early death in older adults (Karakelides & Nair, 2005). Exercise is certainly important to increase strength, aerobic capacity, and muscle protein synthesis, but unfortunately it does not reverse all the age-related changes that occur. The muscle-to-fat ratio for both men and women also changes throughout middle adulthood, with an accumulation of fat in the stomach area.
Lungs: The lungs serve two functions: Supply oxygen and remove carbon dioxide. Thinning of the bones with age can change the shape of the rib cage and result in a loss of lung expansion. Age related changes in muscles, such as the weakening of the diaphragm, can also reduce lung capacity. Both of these changes will lower oxygen levels in the blood and increase the levels of carbon dioxide. Experiencing shortness of breath and feeling tired can result (NIH, 2014b). In middle adulthood, these changes and their effects are often minimal, especially in people who are non-smokers and physically active. However, in those with chronic bronchitis, or who have experienced frequent pneumonia, asthma other lung related disorders, or who are smokers, the effects of these normal age changes can be more pronounced.
8.1.2 Sensory Changes
Vision: A normal change of the eye due to age is presbyopia, which is Latin for “old vision.” It refers to a loss of elasticity in the lens of the eye that makes it harder for the eye to focus on objects that are closer to the person. When we look at something far away, the lens flattens out; when looking at nearby objects tiny muscle fibers around the lens enable the eye to bend the lens. With age these muscles weaken and can no longer accommodate the lens to focus the light. Anyone over the age of 35 is at risk for developing presbyopia. According to the National Eye Institute (NEI) (2016), signs that someone may have presbyopia include:
Hard time reading small print
Having to hold reading material farther than arm’s distance
Problems seeing objects that are close
Headaches
Eyestrain

Another common eye problem people experience as they age are floaters, little spots or “cobwebs” that float around the field of vision. They are most noticeable if you are looking at the sky on a sunny day, or at a lighted blank screen. Floaters occur when the vitreous, a gel-like substance in the interior of the eye, slowly shrinks. As it shrinks, it becomes somewhat stringy, and these strands can cast tiny shadows on the retina. In most cases, floaters are harmless, more of an annoyance than a sign of eye problems. However, floaters that appear suddenly, or that darken and obscure vision can be a sign of more serious eye problems, such a retinal tearing, infection, or inflammation. People who are very nearsighted (myopic), have diabetes, or who have had cataract surgery are also more likely to have floaters (NEI, 2009).
During midlife, adults may begin to notice a drop in scotopic sensitivity, the ability to see in dimmer light. By age 60, the retina receives only one third as much light as it did at age 20, making working in dimmer light more difficult (Jackson & Owsley, 2000). Night vision is also affected as the pupil loses some of its ability to open and close to accommodate drastic changes in light. Eyes become more sensitive to glare from headlights and street lights making it difficult to see people and cars, and movements outside of our direct line of sight (NIH, 2016c).
Finally, some people experience dry eye syndrome, which occurs when the eye does not produce tears properly, or when the tears evaporate too quickly because they are not the correct consistency (NEI, 2013). While dry eye can affect people at any age, nearly 5 million Americans over the age of 50 experience dry eye. It affects women more than men, especially after menopause. Women who experienced an early menopause may be more likely to experience dry eye, which can cause surface damage to the eye.
Hearing: Hearing problems increase during middle adulthood. According to a recent UK study (Dawes et al., 2014), the rate of hearing problems in their sample doubled between the ages of 40 and 55 and tripled by age 64. Similar statistics are found in U.S. samples of middle-aged adults. Prior to age 40, about 5.5% of adults report hearing problems. This jumps to 19% among 40 to 69 year-olds (American Psychological Association, 2016). Middle-aged adults may experience more problems understanding speech when in noisy environments, in comparison to younger adults (Füllgrabe, Moore, & Stone, 2015; Neidleman, Wambacq, Besing, Spitzer, & Koehnke, 2015). As we age we also lose the ability to hear higher frequencies (Humes, Kewley-Port, Fogerty, & Kinney, 2010). Hearing changes are more common among men than women, but males may underestimate their hearing problems (Uchida, Nakashima, Ando, Niino, & Shimokata, 2003). For many adults, hearing loss accumulates after years of being exposed to intense noise levels. Men are more likely to work in noisy occupations. Hearing loss is also exacerbated by cigarette smoking, high blood pressure, diabetes, and stroke. Most hearing loss could be prevented by guarding against being exposed to extremely noisy environments.
8.1.3 Health Concerns
Heart Disease: According to the most recent National Vital Statistics Reports (Kochanek, Murphy, Xu, & Arias, 2019) heart disease continues to be the number one cause of death for Americans as it claimed 23% of those who died in 2017. It is also the number one cause of death worldwide (World Health Organization, 2018). Heart disease develops slowly over time and typically appears in midlife (Hooker & Pressman, 2016).
Heart disease can include heart defects and heart rhythm problems, as well as narrowed, blocked, or stiffened blood vessels referred to as cardiovascular disease. The blocked blood vessels prevent the body and heart from receiving adequate blood. Atherosclerosis, or a buildup of fatty plaque in the arteries, is the most common cause of cardiovascular disease. The plaque buildup thickens the artery walls and restricts the blood flow to organs and tissues. Cardiovascular disease can lead to a heart attack, chest pain (angina), or stroke (Mayo Clinic, 2014a). Figure 8.5 illustrates atherosclerosis.
Symptoms of cardiovascular disease differ for men and women. Males are more likely to suffer chest pain, while women are more likely to demonstrate shortness of breath, nausea, and extreme fatigue. Symptoms can also include pain in the arms, legs, neck, jaw, throat, abdomen or back (Mayo Clinic, 2014a).
According to the Mayo Clinic (2014a) there are many risk factors for developing heart disease, including medical conditions, such as high blood pressure, high cholesterol, diabetes, and obesity. Other risk factors include:
Advanced Age-increased risk for narrowed arteries and weakened or thickened heart muscle.
Sex-males are at greater risk, but a female’s risk increases after menopause.
Family History-increased risk, especially if male parent or brother developed heart. disease before age 55 or female parent or sister developed heart disease before age 65.
Smoking-nicotine constricts blood vessels and carbon monoxide damages the inner lining.
Poor Diet-a diet high in fat, salt, sugar, and cholesterol.
Excessive Alcohol Consumption-alcohol can raise the level of bad fats in the blood and increase blood pressure
Stress-unrelieved stress can damage arteries and worsen other risk factors.
Poor Hygiene-establishing good hygiene habits can prevent viral or bacterial infections that can affect the heart. Poor dental care can also contribute to heart disease.
Complications of heart disease can include heart failure, when the heart cannot pump enough blood to the meet the body’s needs, and a heart attack, such as when a blood clot blocks the blood flow to the heart. This blockage can damage or destroy a part of the heart muscle, and atherosclerosis is a factor in a heart attack. Treatment for heart disease includes medication, surgery, and lifestyle changes including exercise, healthy diet, and refraining from smoking.
Sudden cardiac arrest is the unexpected loss of heart functioning, breathing, and consciousness, often caused by an arrhythmia or abnormal heartbeat. The heart beat may be too quick, too slow, or irregular. With a healthy heart, it is unlikely for a fatal arrhythmia to develop without an outside factor, such as an electric shock or illegal drugs. If not treated immediately, sudden cardiac arrest can be fatal and result in sudden cardiac death.
Hypertension, or high blood pressure, is a serious health problem that occurs when the blood flows with a greater force than normal. One in three American adults (70 million people) have hypertension and only half have it under control (Nwankwo, Yoon, Burt, & Gu, 2013). It can strain the heart, increase the risk of heart attack and stroke, or damage the kidneys (CDC, 2014a). Uncontrolled high blood pressure in early and middle adulthood can also damage the brain’s white matter (axons) and may be linked to cognitive problems later in life (Maillard et al., 2012). Normal blood pressure is under 120/80 (see Table 8.1. The first number is the systolic pressure, which is the pressure in the blood vessels when the heart beats. The second number is the diastolic pressure, which is the pressure in the blood vessels when the heart is at rest. High blood pressure is sometimes referred to as the silent killer, as most people with hypertension experience no symptoms. Making positive lifestyle changes can often reduce blood pressure.
| Systolic Pressure | Diastolic Pressure | |
|---|---|---|
| Normal | Under 120 | Under 80 |
| Elevated | 120-129 | Under 80 |
| Hypertension Stage 1 | 130-139 | 80-89 |
| Hypertension Stage 2 | 140 | >90 |
Risk factors for high blood pressure include:
Family history of hypertension
Diet that is too high in sodium, often found in processed foods, and too low in potassium
Sedentary lifestyle and Obesity
Too much alcohol consumption
Tobacco use, as nicotine raises blood pressure (CDC, 2014b).
Cancer: After heart disease, cancer was the second leading cause of death for Americans in 2017 as it accounted for 21.3% of all deaths (Kochanek et al., 2016). According to the National Institutes of Health (2015), cancer is the name given to a collection of related diseases in which the body’s cells begin to divide without stopping and spread into surrounding tissues. These extra cells can divide, and form growths called tumors, which are typically masses of tissue. Cancerous tumors are malignant, which means they can invade nearby tissues. When removed malignant tumors may grow back. Unlike malignant tumors, benign tumors do not invade nearby tissues. Benign tumors can sometimes be quite large, and when removed usually do not grow back. Although benign tumors in the body are not cancerous, benign brain tumors can be life threatening.
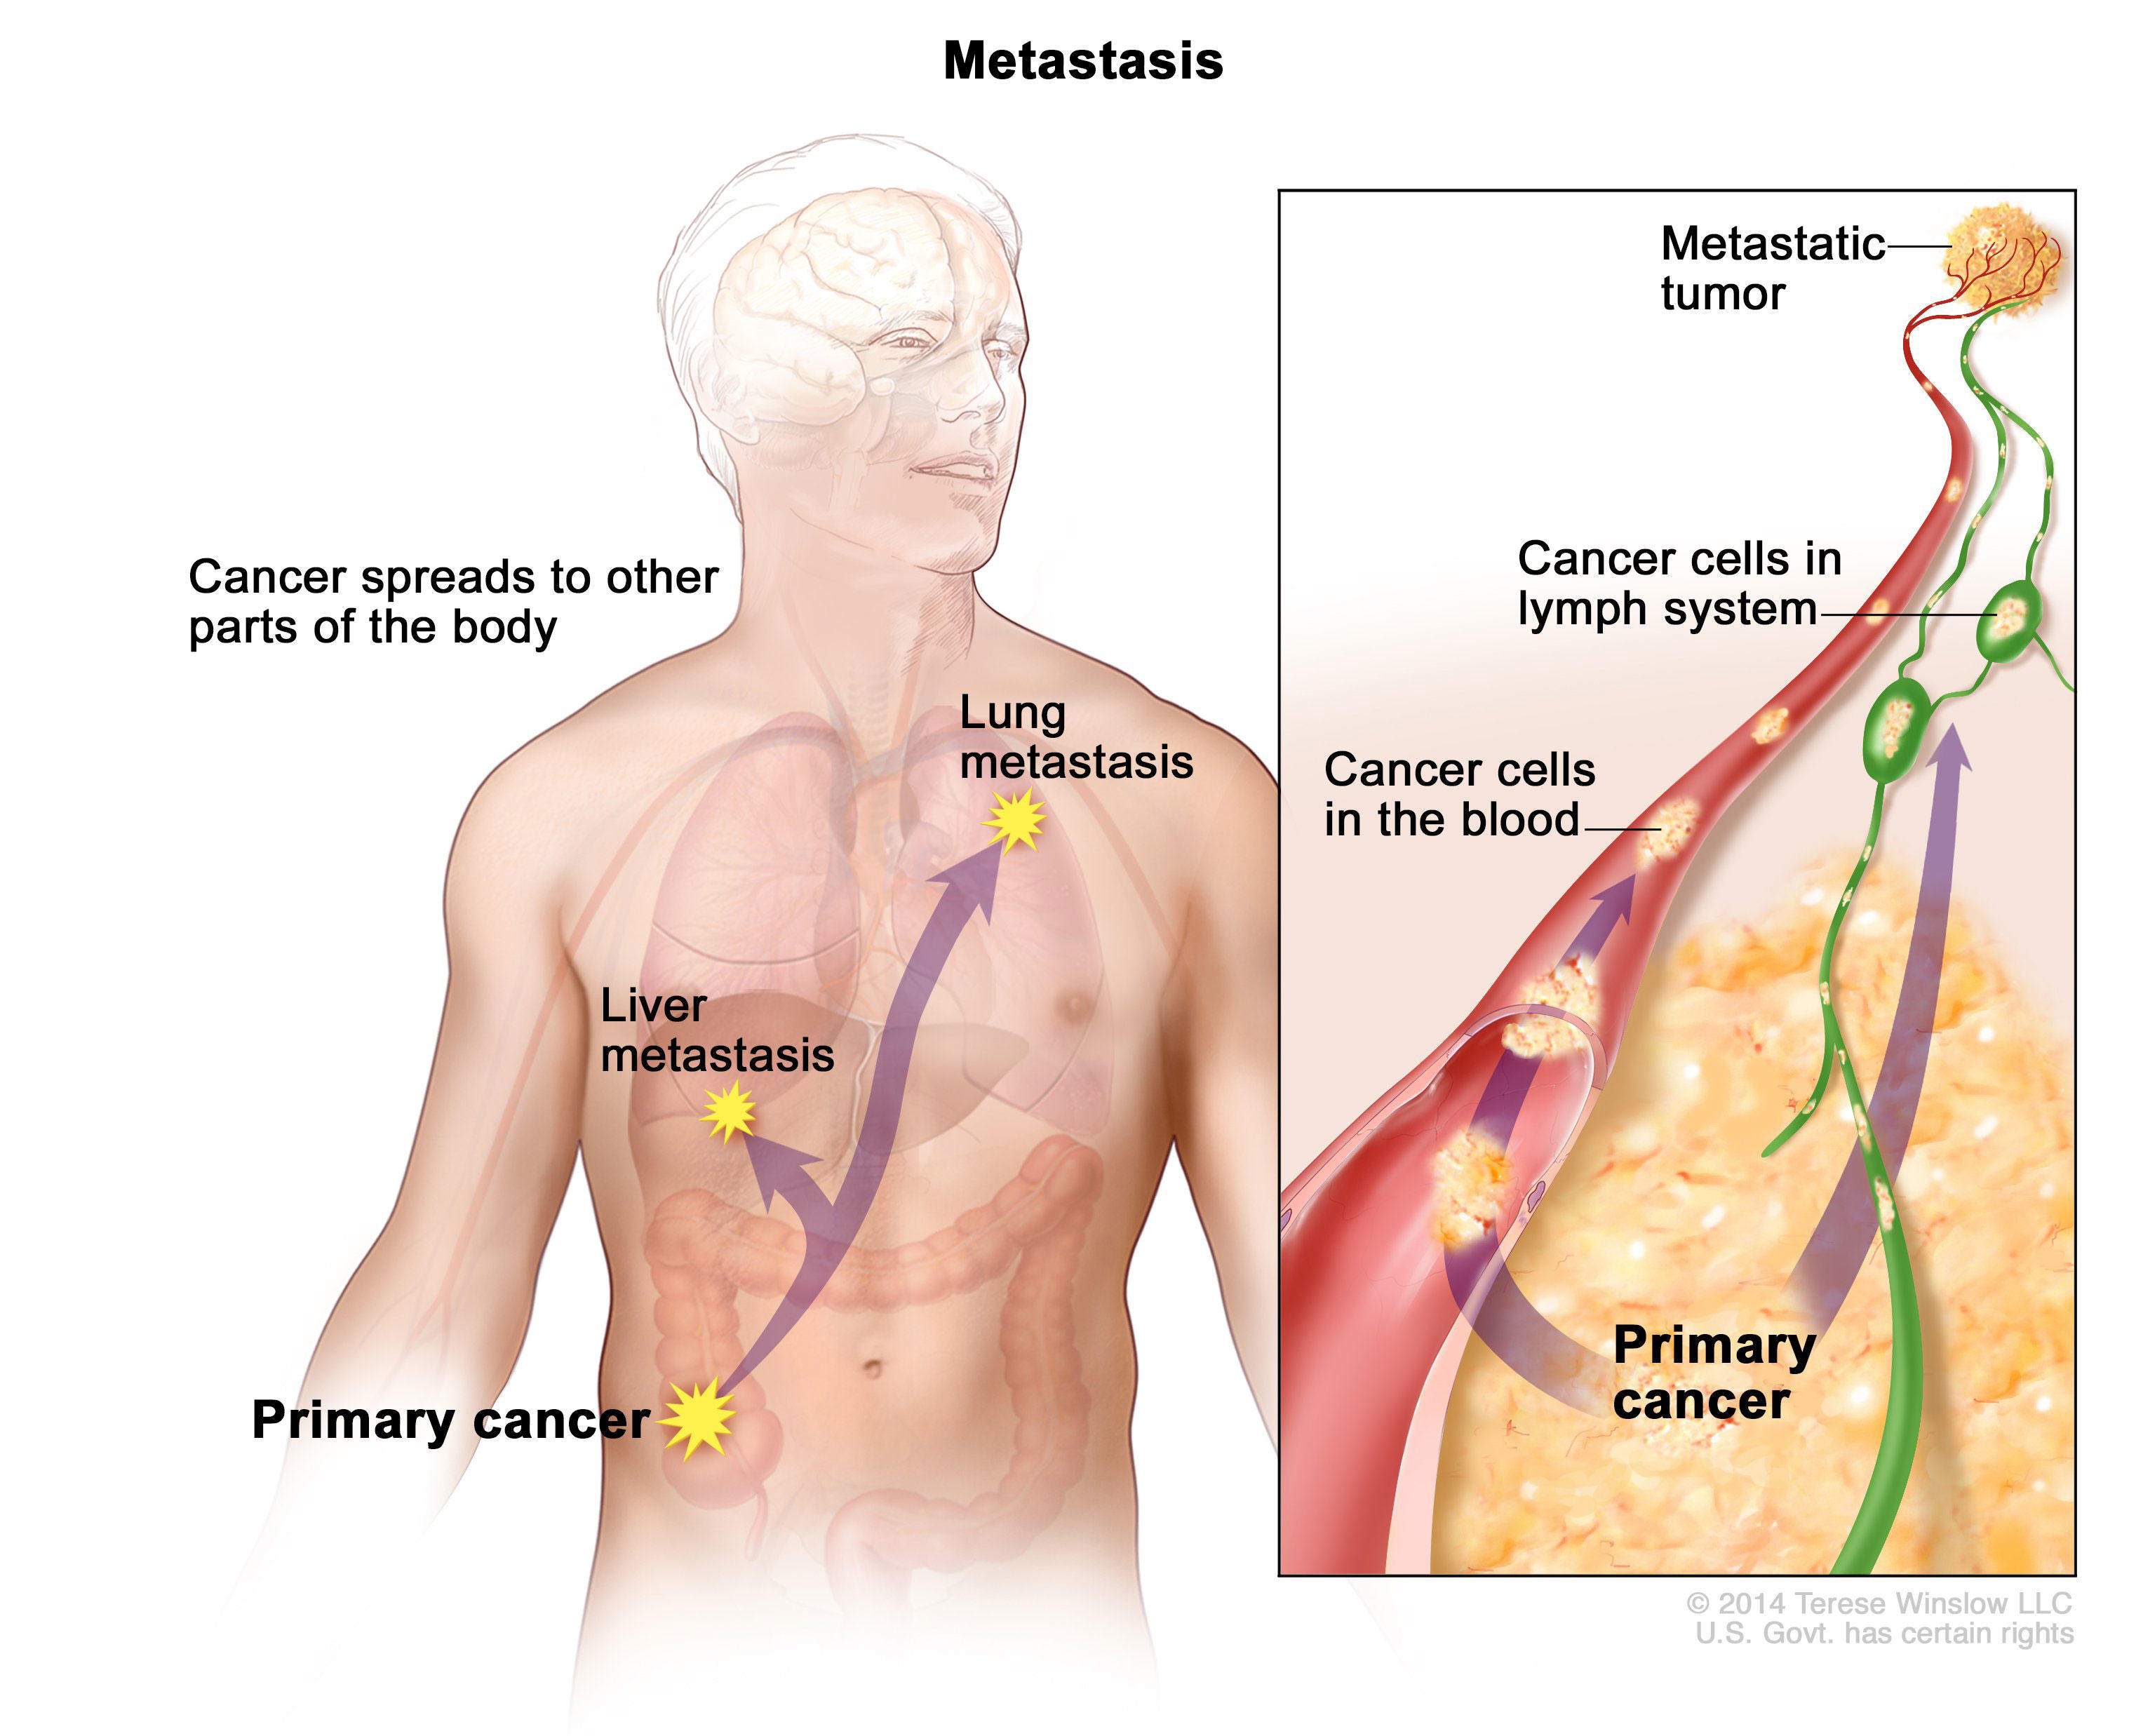
Cancer cells can prompt nearby normal cells to form blood vessels that supply the tumors with oxygen and nutrients, which allows them to grow. These blood vessels also remove waste products from the tumors. Cancer cells can also hide from the immune system, a network of organs, tissues, and specialized cells that protects the body from infections and other conditions. Lastly, cancer cells can metastasize, which means they can break from where they first formed, called the primary cancer, and travel through the lymph system or blood to form new tumors in other parts of the body. This new metastatic tumor is the same type as the primary tumor (National Institutes of Health, 2015). Figure 8.6 illustrates how cancers can metastasize.
Cancer can start almost anywhere in the human body. While normal cells mature into very distinct cell types with specific functions, cancer cells do not and continue to divide without stopping. Further, cancer cells are able to ignore the signals that normally tell cells to stop dividing or to begin a process known as programmed cell death which the body uses to get rid of unneeded cells. With the growth of cancer cells, normal cells are crowded out and the body is unable to work the way it is supposed to. For example, the cancer cells in lung cancer form tumors which interfere with the functioning of the lungs and how oxygen is transported to the rest of the body.
There are more than 100 types of cancer. The American Cancer Society assemblies a list of the most common types of cancers in the United States. To qualify for the 2016 list, the estimated annual incidence had to be 40, 000 cases or more. The most common type of cancer on the list is breast cancer, with more than 249,000 new cases expected in 2016. The next most common 314
cancers are lung cancer and prostate cancer. Table 8.2 lists the estimated number of new cases and deaths for each common cancer type for 2019 (American Cancer Society, 2019).
| Cancer Type | Estimated New Cases | Estimated Deaths |
|---|---|---|
| Bladder | 80,470 | 17,670 |
| Breast (Female – Male) | 268,600-2670 | 41,760-500 |
| Colon | 101,420 | 51,020 |
| Kidney and Renal Pelvis | 73,820 | 14,770 |
| Leukemia (All Types) | 61,780 | 22,840 |
| Lung (Including Bronchus) | 228,150 | 142,670 |
| Melanoma | 32,110 | 12,960 |
| Non-Hodgkin Lymphoma | 74,200 | 19,970 |
| Pancreatic | 56,770 | 45,750 |
| Prostate | 174,650 | 31,620 |
| Thyroid | 52,070 | 2,170 |
| Uterine | 75,050 | 16,410 |
Cholesterol is a waxy fatty substance carried by lipoprotein molecules in the blood. It is created by the body to create hormones and digest fatty foods and is also found in many foods. Your body needs cholesterol, but too much can cause heart disease and stroke. Two important kinds of cholesterol are low-density lipoprotein (LDL) and high-density lipoprotein (HDL). A third type of fat is called triglycerides. Your total cholesterol score is based on all three types of lipids (see Table 8.3). Total cholesterol is calculated by adding HDL plus LDL plus 20% of the Triglycerides.
LDL cholesterol makes up the majority of the body’s cholesterol, however, it is often referred to as “bad” cholesterol because at high levels it can form plaque in the arteries leading to heart attack and stroke. HDL cholesterol, often referred to as “good” cholesterol, absorbs cholesterol and carries it back to the liver, where it is then flushed from the body. Higher levels of HDL can reduce the risk of heart attack and stroke. Triglycerides are a type of fat in the blood used for energy. High levels of triglycerides can also increase your risk for heart disease and stroke when coupled with high LDL and low HDL. All adults 20 or older should have their cholesterol checked. In early adulthood, doctors may check every few years if the numbers have previously been normal, and there are no other signs of heart disease. In middle adulthood, this may become part of the annual check-up (CDC, 2015).
| Normal | |
| Total Cholesterol | Less than 200mg/dl* |
| LDL | Less than 100mg/dl |
| HDL | 40mg/dl or higher |
| Triglycerides | Less than 150mg/dl |
*Cholesterol levels are measured in milligrams (mg) of cholesterol per deciliter (dl) of blood.
Risk factors for high cholesterol include: A family history for high cholesterol, diabetes, a diet high in saturated fats, trans fat, and cholesterol, physical inactivity, and obesity. Almost 32% of American adults have high LDL cholesterol levels, and the majority do not have it under control, nor have they made lifestyle changes (CDC, 2015).
Diabetes (Diabetes Mellitus) is a disease in which the body does not control the amount of glucose in the blood. This disease occurs when the body does not make enough insulin or does not use it the way it should (NIH, 2016a). Insulin is a type of hormone that helps glucose in the blood enter cells to give them energy. In adults, 90% to 95% of all diagnosed cases of diabetes are type 2 (American Diabetes Association (ADA), 2016). Type 2 diabetes usually begins with insulin resistance, a disorder in which the cells in the muscles, liver, and fat tissue do not use insulin properly (CDC, 2014d). As the need for insulin increases, cells in the pancreas gradually lose the ability to produce enough insulin. In some Type 2 diabetics, pancreatic beta cells will cease functioning, and the need for insulin injections will become necessary. Some people with diabetes experience insulin resistance with only minor dysfunction of the beta cell secretion of insulin. Other diabetics experience only slight insulin resistance, with the primary cause being a lack of insulin secretion (CDC, 2014d).
One in three adults are estimated to have prediabetes, and 9 in 10 of them do not know. According to the CDC (2014d) without intervention, 15% to 30% of those with prediabetes will develop diabetes within 5 years. In 2015, 30.2 million people (9.4% of the population) were living with diabetes in America, mostly adults age 18 and up (CDC, 2017). Table 8.4 shows the numbers in millions and percentage of adults, by age and gender, with both diagnosed and undiagnosed diabetes. The median age of diagnosis is 54 (CDC, 2014d). During middle adulthood, the number of people with diabetes dramatically increases; with 4.3 million living with diabetes prior to age 45, to over 13 million between the ages of 45 to 64; a four-fold increase. Men are slightly more likely to experience diabetes than are women.
Typical tests for diabetes include a fasting glucose test and the A1C (See Table 8.4). Fasting glucose levels should be under 100mg/dl (ADA, 2016). The A1C provides information about the average levels of blood glucose over the last 3 months (NIH, 2014a). The A1C should be under 5.7, where a 5.0 = 97mg/dl and a 6.0 = 126 mg/dl (ADA, 2016).
| Normal | Prediabetes | Diabetes | |
|---|---|---|---|
| Fasting Glucose | Below 100mg/dl | 100-125mg/dl | 126mg/dl + |
| A1C | Under 5.7 | 5.7-6.9 | 7+ |
Metabolic Syndrome is a cluster of several cardiometabolic risk factors, including large waist circumference, high blood pressure, and elevated triglycerides, LDL, and blood glucose levels, which can lead to diabetes and heart disease (Crist et al., 2012). The prevalence of metabolic syndrome in the U.S. is approximately 34% and is especially high among Hispanics and African Americans (Ford, Li, & Zhao, 2010). Prevalence increases with age, peaking in one’s 60s (Ford et al., 2010). Metabolic syndrome increases morbidity from cardiovascular disease and diabetes (Hu et al., 2004; Malik, 2004). Hu and colleagues found that even having one or two of the risk factors for metabolic syndrome increased the risk of mortality. Crist et al. (2012) found that increasing aerobic activity and reducing weight led to a drop in many of the risk factors of metabolic syndrome, including a reduction in waist circumference and blood pressure, and an increase in HDL cholesterol.
Rheumatoid arthritis (RA) is an inflammatory disease that causes pain, swelling, stiffness, and loss of function in the joints (NIH, 2016b). RA occurs when the immune system attacks the membrane lining the joints (see Figure 8.8). RA is the second most common form of arthritis after osteoarthritis, which is the normal wear and tear on the joints discussed in chapter 9. Unlike osteoarthritis, RA is symmetric in its attack of the body, thus, if one shoulder is affected so is the other. In addition, those with RA may experience fatigue and fever. Below are the common features of RA (NIH, 2016b).
Features of Rheumatoid Arthritis
Tender, warm, swollen joints
Symmetrical pattern of affected joints
Joint inflammation often affecting the wrist and finger joints closest to the hand
Joint inflammation sometimes affecting other joints, including the neck, shoulders, elbows, hips, knees, ankles, and feet
Fatigue, occasional fevers, a loss of energy
Pain and stiffness lasting for more than 30 minutes in the morning or after a long rest
Symptoms that last for many years
Variability of symptoms among people with the disease.
About 1.5 million people (approximately 0.6%) of Americans experience rheumatoid arthritis. It occurs across all races and age groups, although the disease often begins in middle adulthood and occurs with increased frequency in older people. Like some other forms of arthritis, rheumatoid arthritis occurs much more frequently in women than in men. About two to three times as many women as men have the disease (NIH, 2016b). The lifetime risk for RA for women is 3.6% and 1.7% for men (Crowson, et al., 2011).
Genes play a role in the development of RA. However, individual genes by themselves confer only a small risk of developing the disease, as some people who have these particular genes never develop RA. Scientists think that something must occur to trigger the disease process in people whose genetic makeup makes them susceptible to rheumatoid arthritis. For instance, some scientists also think hormonal factors may be involved. In women who experience RA, the symptoms may improve during pregnancy and flare after pregnancy. Women who use oral contraceptives may increase their likelihood of developing RA. This suggests hormones, or possibly deficiencies or changes in certain hormones, may increase the risk of developing RA in a genetically susceptible person (NIH, 2016b).
Rheumatoid arthritis can affect virtually every area of a person’s life, and it can interfere with the joys and responsibilities of work and family life. Fortunately, current treatment strategies allow most people with RA to lead active and productive lives. Pain-relieving drugs and medications can slow joint damage and establishing a balance between rest and exercise can also lessen the symptoms of RA (NIH, 2016b).
Fatty liver disease (hepatic steatosis) refers to the accumulation of fat in the liver. The liver normally contains little fat, and anything below 5% of liver weight is considered normal. This disease is present in 33% of American adults. In the past the main cause of fat accumulation in the liver was due to excessive alcohol consumption, often eventually leading to cirrhosis and liver failure. Today, increased caloric intake, especially resulting in obesity, and little physical activity are the main causes. Mild to moderate levels of hepatic steatosis can be reversed through healthy lifestyle changes (Nassir, Rector, Hammoud, & Ibdah, 2015). 319
8.1.4 Digestive Issues
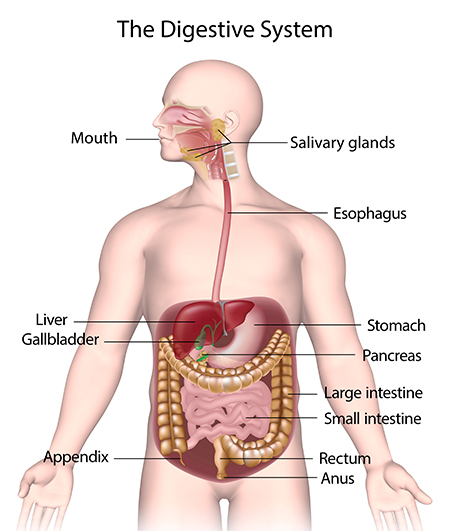
Heartburn, also called acid indigestion or pyrosis, is a common digestive problem in adults and is the result of stomach acid backing up into the esophagus. Prolonged contact with the digestive juices injures the lining of the esophagus and causes discomfort. Heartburn that occurs more frequently may be due to gastroesophageal reflux disease or GERD. Normally the lower sphincter muscle in the esophagus keeps the acid in the stomach from entering the esophagus. In GERD this muscle relaxes too frequently and the stomach acid flows into the esophagus. In the U.S., 60 million people experience heartburn at least once a month, and 15 million experience it every day. Prolonged problems with heartburn can lead to more serious complications, including esophageal cancer, one of the most lethal forms of cancer in the U.S. Problems with heartburn can be linked to eating fatty or spicy foods, caffeine, smoking, and eating before bedtime (American College of Gastroenterology, 2016a).
Gallstones are hard particles, including fatty materials, bile pigments, and calcium deposits, that can develop in the gallbladder. Ranging in size from a grain of sand to a golf ball, they typically take years to develop, but in some people have developed over the course of a few months. About 75% of gallstones do not create any symptoms, but those that do may cause sporadic upper abdominal pain when stones block bile or pancreatic ducts. If stones become lodged in the ducts, it may necessitate surgery or other medical intervention as it could become life-threatening if left untreated (American College of Gastroenterology, 2016b).
Gallstones are present in about 20% of women and 10% of men over the age of 55 (American College of Gastroenterology, 2016b). Risk factors include a family history of gallstones, diets high in calories and refined carbohydrates (such as, white bread and rice), diabetes, metabolic syndrome, Crohn’s disease, and obesity, which increases the cholesterol in the bile and thus increases the risk of developing gallstones (NIH, 2013).
8.1.5 Sleep
According to the American Academy of Sleep Medicine (Kasper, 2015) adults require at least 7 hours of sleep per night to avoid the health risks associated with chronic sleep deprivation. Less than 6 hours and more than 10 hours is also not recommended for those in middle adulthood (National Sleep Foundation, 2015). Not surprisingly, many Americans do not receive the 7-9 hours of sleep recommended. In 2013, only 59% of U.S. adults met that standard, while in 1942, 84% did (Jones, 2013). This means 41% of Americans receive less than the recommended amount of nightly sleep. Additional results included that in 1993, 67% of Americans felt they were getting enough sleep, but in 2013 only 56% felt they received as much sleep as needed. Additionally, 43% of Americans in 2013 believed they would feel better with more sleep.
Sleep problems: According to the Sleep in America poll (National Sleep Foundation, 2015), 9% of Americans report being diagnosed with a sleep disorder, and of those 71% have sleep apnea and 24% suffer from insomnia. Pain is also a contributing factor in the difference between the amount of sleep Americans say they need and the amount they are getting. An average of 42 minutes of sleep debt occur for those with chronic pain, and 14 minutes for those who have suffered from acute pain in the past week. Stress and overall poor health are also key components of shorter sleep durations and worse sleep quality. Those in midlife with lower life satisfaction experienced greater delay in the onset of sleep than those with higher life satisfaction. Delayed onset of sleep could be the result of worry and anxiety during midlife, and improvements in those areas should improve sleep. Lastly, menopause can affect a woman’s sleep duration and quality (National Sleep Foundation, 2016).
Children in the home and sleep: As expected, having children at home affects the amount of sleep one receives. According to a 2016 National Center for Health Statistics analysis (CDC, 2016) having children decreases the amount of sleep an individual receives, however, having a partner can improve the amount of sleep for both males and females. Figure 8.5 illustrates the percentage of individuals not receiving seven hours of sleep per night based on parental role.
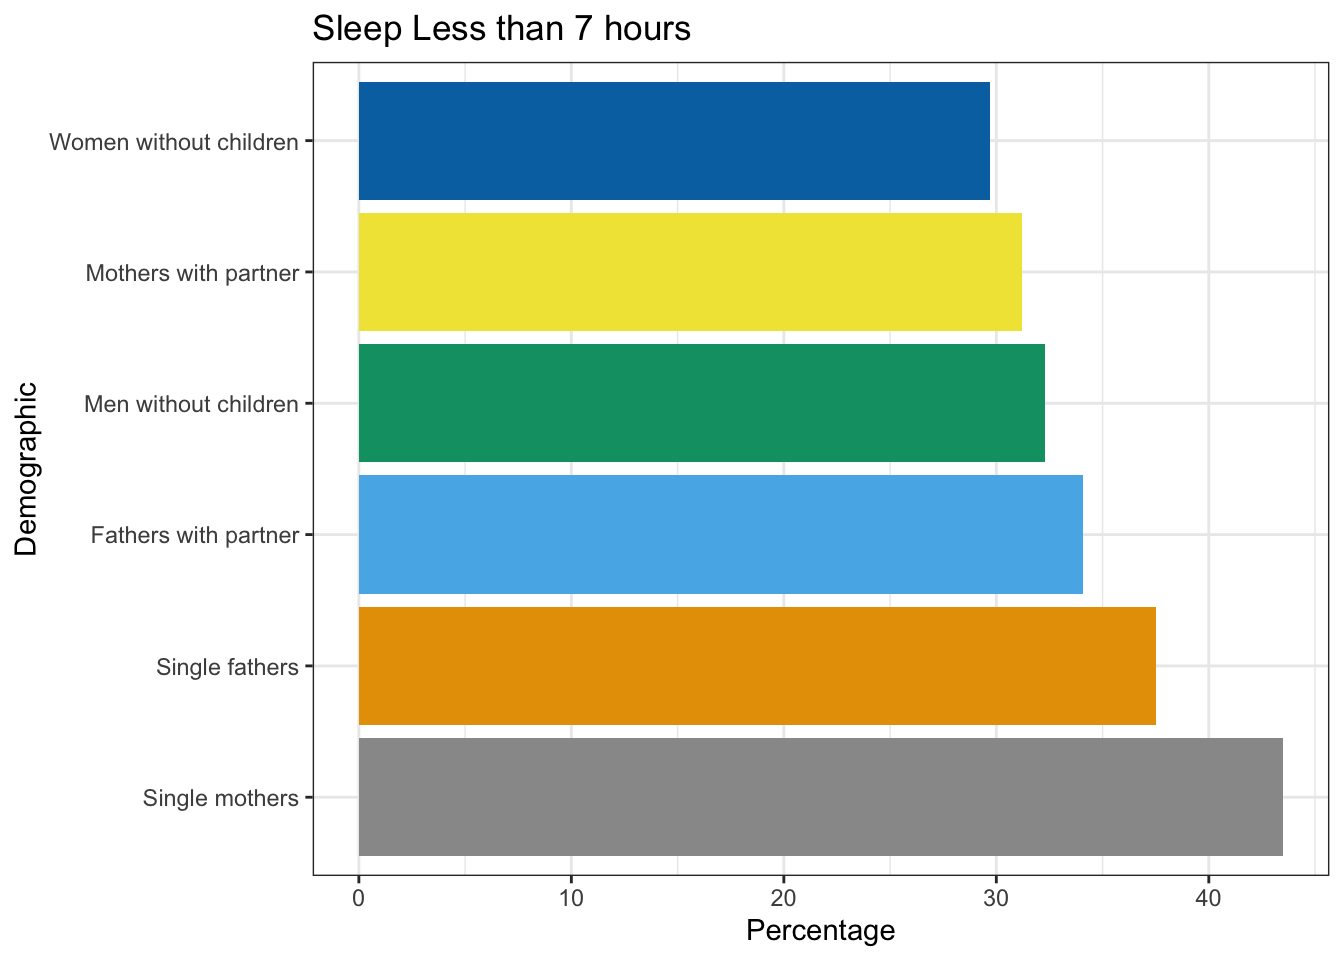
| Demographic | Sleep Less than 7 hours (%) |
|---|---|
| Women without children | 29.7 |
| Mothers with partner | 31.2 |
| Men without children | 32.3 |
| Fathers with partner | 34.1 |
| Single fathers | 37.5 |
| Single mothers | 43.5 |
Negative consequences of insufficient sleep: There are many consequences of too little sleep, and they include physical, cognitive, and emotional changes. Sleep deprivation suppresses immune responses that fight off infection, and can lead to obesity, memory impairment, and hypertension (Ferrie et al., 2007; Kushida, 2005). Insufficient sleep is linked to an increased risk for colon cancer, breast cancer, heart disease and type 2 diabetes (Pattison, 2015). A lack of sleep can increase stress as cortisol (a stress hormone) remains elevated which keeps the body in a state of alertness and hyperarousal which increases blood pressure. Sleep is also associated with longevity. Dew et al. (2003) found that older adults who had better sleep patterns also lived longer. During deep sleep a growth hormone is released which stimulates protein synthesis, breaks down fat that supplies energy, and stimulates cell division.
Consequently, a decrease in deep sleep contributes to less growth hormone being released and subsequent physical decline seen in aging (Pattison, 2015).
Sleep disturbances can also impair glucose functioning in middle adulthood. Caucasian, African American, and Chinese non-shift-working women aged 48–58 years who were not taking insulin-related medications, participated in the Study of Women’s Health across the Nation (SWAN) Sleep Study and were subsequently examined approximately 5 years later (Taylor et al., 2016). Body mass index (BMI) and insulin resistance were measured at two time points. Results indicated that irregular sleep schedules, including highly variable bedtimes and staying up much later than usual, are associated in midlife women with insulin resistance, which is an important indicator of metabolic health, including diabetes risk. Diabetes risk increases in midlife women, and irregular sleep schedules may be an important reason because irregular bedtime schedules expose the body to varying levels of light, which is the most important timing cue for the body’s circadian clock. By disrupting circadian timing, bedtime variability may impair glucose metabolism and energy homeostasis.
8.1.6 Exercise, Nutrition, and Weight
The impact of exercise: Exercise is a powerful way to combat the changes we associate with aging. Exercise builds muscle, increases metabolism, helps control blood sugar, increases bone density, and relieves stress. Unfortunately, fewer than half of midlife adults exercise and only about 20 percent exercise frequently and strenuously enough to achieve health benefits. Many stop exercising soon after they begin an exercise program, particularly those who are very overweight. The best exercise programs are those that are engaged in regularly, regardless of the activity. A well-rounded program that is easy to follow includes walking and weight training. Having a safe, enjoyable place to walk can make the difference in whether or not someone walks regularly. Weight lifting and stretching exercises at home can also be part of an effective program. Exercise is particularly helpful in reducing stress in midlife. Walking, jogging, cycling, or swimming can release the tension caused by stressors. Learning relaxation techniques can also have healthful benefits. Exercise can be thought of as preventative health care. Promoting exercise for the 78 million “baby boomers” may be one of the best ways to reduce health care costs and improve quality of life (Shure & Cahan, 1998).
According to the Office of Disease Prevention and Health Promotion (2008), the following are exercise guidelines for adults:
Adults should avoid being inactive. Any activity will result in some health benefits.
For substantial health benefits, adults should engage in at least 150 minutes per week of moderate intensity exercise OR at least 75 minutes of vigorous intensity aerobic activity. Aerobic activity should occur for at least 10 minutes and preferably spread throughout the week.
For more extensive health benefits, adults can increase their aerobic activity to 300 minutes per week of moderate intensity OR 150 minutes per week of vigorous intensity aerobic activity.
Adults should also participate in muscle-strengthening activities that are moderate or high intensity and involve all major muscle groups on two or more days per week.
Nutritional concerns: Aging brings about a reduction in the number of calories a person requires (see Table 8.7 for estimated caloric needs in middle-aged adults). Many Americans respond to weight gain by dieting. However, eating less does not typically mean eating right and people often suffer vitamin and mineral deficiencies as a result. All adults need to be especially cognizant of the amount of sodium, sugar, and fat they are ingesting.
| Males | Females[d] | |||||
| Age | Sedentary[a] | Moderately Active[b] | Active[c] | Sedentary [a] | Moderately Active [b] | Active [c] |
| 36-40 | 2400 | 2600 | 2800 | 1800 | 2000 | 2200 |
| 41-45 | 2200 | 2600 | 2800 | 1800 | 2000 | 2200 |
| 46-50 | 2200 | 2400 | 2800 | 1800 | 2000 | 2200 |
| 51-55 | 2200 | 2400 | 2800 | 1600 | 1800 | 2200 |
| 56-60 | 2200 | 2400 | 2600 | 1600 | 1800 | 2200 |
| 61-65 | 2000 | 2400 | 2600 | 1600 | 1800 | 2000 |
[a]Sedentary means a lifestyle that includes only the physical activity of independent living
[b]Moderate activity means a lifestyle that includes physical activity equivalent to walking more than 1.5 to 3 miles per day at 3 or 4 miles per hour, in addition to the activities of independent living.
[c]Active means a lifestyle that includes physical activity of walking more than 3 miles per day at 3 or 4 miles per hour, in addition to the activities of independent living.
[d]Estimates for females do not include women who are pregnant or breastfeeding
Excess Sodium: According to dietary guidelines, adults should consume less than 2,300mg (1 teaspoon) per day of sodium. The American Heart Association (2016) reports that the average sodium intake among Americans is 3440mg per day. Processed foods are the main culprits of excess sodium. High sodium levels in the diet is correlated with increased blood pressure, and its reduction does show corresponding drops in blood pressure. Adults with high blood pressure are strongly encouraged to reduce their sodium intake to 1500mg (U.S. Department of Health and Human Services & U.S. Department of Agriculture (USHHS & USDA), 2015).
Excess Fat: Dietary guidelines also suggests that adults should consume less than 10 percent of calories per day from saturated fats. The American Heart Association (2016) says optimally we should aim for a dietary pattern that achieves 5% to 6% of calories from saturated fat. In a 2000 calorie diet that is about 120 calories from saturated fat. In the average American diet about 34.3% of the diet comes from fat, with 15.0% from saturated fat (Berglund et al., 1999). Diets high in fat not only contribute to weight gain, but have been linked to heart disease, stroke, and high cholesterol.
Added Sugar: According to the recent Dietary Guidelines for Americans (USHHS & USDA, 2015) eating healthy means adults should consume less than 10 percent of calories per day from added sugars. Yet, currently about 15% of the calories in the American adult diet come from added sugars, or about 22 teaspoons of sugar per day (NIH, 2014c). Excess sugar not only contributes to weight gain, but diabetes and other health problems.
Metabolism and Weight Gain: One of the common complaints of midlife adults is weight gain, especially the accumulation of fat in the abdomen, which is often referred to as the middle-aged spread (Lachman, 2004). Men tend to gain fat on their upper abdomen and back, while women tend to gain more fat on their waist and upper arms. Many adults are surprised at this weight gain because their diets have not changed, however, their metabolism has slowed during midlife. Metabolism is the process by which the body converts food and drink into energy. The calories consumed are combined with oxygen to release the energy needed to function (Mayo Clinic, 2014b). People who have more muscle burn more calories, even at rest, and thus have a higher metabolism.

However, as you get older, the amount of muscle decreases. Consequently, fat accounts for more of one’s weight in midlife. and fat slows down the number of calories burned. To compensate, midlife adults have to increase their level of exercise, eat less, and watch their nutrition to maintain their earlier physique.
Obesity: As discussed in the early adulthood chapter, obesity is a significant health concern for adults throughout the world, and especially America. Obesity rates continue to increase and the current rate for those 40-59 is 42.8%, which is the highest percentage per age group (CDC, 2017). Being overweight is associated with a myriad of health conditions including diabetes, high blood pressure, and heart disease. New research is now linking obesity to Alzheimer’s disease. Chang et al. (2016) found that being overweight in midlife was associated with earlier onset of Alzheimer’s disease. The study looked at 1,394 men and women who were part of the Baltimore Longitudinal Study of Aging. Their average age was around 60, and they were followed for 14 years. Results indicated that people with the highest body mass index, or BMI, at age 50 were more likely to develop Alzheimer’s disease. In fact, each one-point increase in BMI was associated with getting Alzheimer’s six to seven months earlier. Those with the highest BMIs also had more brain changes typical of Alzheimer’s, even if they did not have symptoms of the disease. Scientists speculate that fat cells may produce harmful chemicals that promote inflammation in blood vessels throughout the body, including in the brain. The conclusion of the study was that a healthy BMI at midlife may delay the onset of Alzheimer’s disease.
Concluding Thoughts: Many of the changes that occur in midlife can be easily compensated for, such as buying glasses, exercising, and watching what one eats. However, the percentage of 324
middle adults who have a significant health concern has increased in the past 15 years. According to the 2016 United Health Foundation’s America’s Health Rankings Senior Report, the next generation of seniors will be less healthy than the current seniors (United Health Foundation, 2016). The study compared the health of middle-aged Americans (50-64 years of age) in 2014 to middle-aged Americans in 1999. Results indicated that in the past 15 years the prevalence of diabetes has increased by 55% and the prevalence of obesity has increased by 25%. At the state level, Massachusetts ranked first for healthy seniors, while Louisiana ranked last. Illinois ranked 36th, while Wisconsin scored higher at 13th.
What can we conclude from this information? Lifestyle has a strong impact on the health status of midlife adults, and it becomes important for midlife adults to take preventative measures to enhance physical well-being. Those midlife adults who have a strong sense of mastery and control over their lives, who engage in challenging physical and mental activity, who engage in weight bearing exercise, monitor their nutrition, receive adequate sleep, and make use of social resources are most likely to enjoy a plateau of good health through these years (Lachman, 2004).
8.1.7 Climacteric
The climacteric, or the midlife transition when fertility declines, is biologically based but impacted by the environment. During midlife, men may experience a reduction in their ability to reproduce. Women, however, lose their ability to reproduce once they reach menopause.
Female Sexual and Reproductive Health: Perimenopause refers to a period of transition in which a woman’s ovaries stop releasing eggs and the level of estrogen and progesterone production decreases. Menopause is defined as 12 months without menstruation. The average age of menopause is approximately 51, however, many women begin experiencing symptoms in their 40s. These symptoms occur during perimenopause, which can occur 2 to 8 years before menopause (Huang, 2007). A woman may first begin to notice that her periods are more or less frequent than before. After a year without menstruation, a woman is considered menopausal and no longer capable of reproduction.
Symptoms: The symptoms that occur during perimenopause and menopause are typically caused by the decreased production of estrogen and progesterone (North American Menopause Society, 2016). The shifting hormones can contribute to the inability to fall asleep. Additionally, the declining levels of estrogen may make a woman more susceptible to environmental factors and stressors which disrupt sleep. A hot flash is a surge of adrenaline that can awaken the brain from sleep. It often produces sweat and a change of temperature that can be disruptive to sleep and comfort levels. Unfortunately, it may take time for adrenaline to recede and allow sleep to occur again (National Sleep Foundation, 2016).
The loss of estrogen also affects vaginal lubrication which diminishes and becomes waterier and can contribute to pain during intercourse. The vaginal wall also becomes thinner, and less elastic. Estrogen is also important for bone formation and growth, and decreased estrogen can cause osteoporosis resulting in decreased bone mass. Depression, irritability, and weight gain are often associated with menopause, but they are not menopausal (Avis, Stellato & Crawford, 2001; Rossi, 2004). Weight gain can occur due to an increase in intra-abdominal fat followed by a loss of lean body mass after menopause (Morita et al., 2006). Consequently, women may need 325
to change their lifestyle to counter any weight gain. Depression and mood swings are more common during menopause in women who have prior histories of these conditions rather than those who have not. Additionally, the incidence of depression and mood swings is not greater among menopausal women than non-menopausal women. Figure 8.12 identifies symptoms experienced by women during menopause, however, women vary greatly in the extent to which these symptoms are experienced. Most American women go through menopause with few problems (Carroll, 2016). Overall, menopause is not seen as universally distressing (Lachman, 2004).
.png)
Hormone Replacement Therapy: Concerns about the effects of hormone replacement has changed the frequency with which estrogen replacement and hormone replacement therapies have been prescribed for menopausal women. Estrogen replacement therapy was once commonly used to treat menopausal symptoms. However, more recently, hormone replacement therapy has been associated with breast cancer, stroke, and the development of blood clots (NIH, 2007). Most women do not have symptoms severe enough to warrant estrogen or hormone replacement therapy. If so, they can be treated with lower doses of estrogen and monitored with more frequent breast and pelvic exams. There are also some other ways to reduce symptoms. These include avoiding caffeine and alcohol, eating soy, remaining sexually active, practicing relaxation techniques, and using water-based lubricants during intercourse.
Menopause and Ethnicity: In a review of studies that mentioned menopause, symptoms varied greatly across countries, geographic regions, and even across ethnic groups within the same region (Palacios, Henderson, & Siseles, 2010). For example, the Study of Women’s Health across the Nation (SWAN) examined 14,906 white, African American, Hispanic, Japanese American, and Chinese American women’s menopausal experiences (Avis et al., 2001). After controlling for age, educational level, general health status, and economic stressors, white women were more likely to disclose symptoms of depression, irritability, forgetfulness, and headaches compared to women in the other racial/ethnic groups. African American women experienced more night sweats, but this varied across research sites. Finally, Chinese American and Japanese American reported fewer menopausal symptoms when compared to the women in the other groups. Overall, the Chinese and Japanese group reported the fewest symptoms, while white women reported more mental health symptoms and African American women reported more physical symptoms.
Cultural Differences: Cultural influences seem to also play a role in the way menopause is experienced. Further, the prevalence of language specific to menopause is an important indicator of the occurrence of menopausal symptoms in a culture. Hmong tribal women living in Australia and Mayan women report that there is no word for “hot flashes” and both groups did not experience these symptoms (Yick-Flanagan, 2013). When asked about physical changes during menopause, the Hmong women reported lighter or no periods. They also reported no emotional symptoms and found the concept of emotional difficulties caused by menopause amusing (Thurston & Vissandjee, 2005). Similarly, a study with First Nation women in Canada found there was no single word for “menopause” in the Oji-Cree or Ojibway languages, with women referring to menopause only as “that time when periods stop” (Madden, St Pierre-Hansen & Kelly, 2010).

While some women focus on menopause as a loss of youth, womanhood, and physical attractiveness, career-oriented women tend to think of menopause as a liberating experience. Japanese women perceive menopause as a transition from motherhood to a more whole person, and they no longer feel obligated to fulfill certain expected social roles, such as the duty to be a mother (Kagawa-Singer, Wu, & Kawanishi, 2002). In India, 94% of women said they welcomed menopause. Aging women gain status and prestige and no longer have to go through self-imposed menstrual restrictions, which may contribute to Indian women’s experiences (Kaur, Walia, & Singh, 2004). Overall, menopause signifies many different things to women around the world and there is no typical experience. Further, normalizing rather than pathologizing menopause is supported by research and women’s experiences.
Male Sexual and Reproductive Health: Although males can continue to father children throughout middle adulthood, erectile dysfunction (ED) becomes more common. Erectile dysfunction refers to the inability to achieve an erection or an inconsistent ability to achieve an erection (Swierzewski, 2015). Intermittent ED affects as many as 50% of men between the ages of 40 and 70. About 30 million men in the United States experience chronic ED, and the percentages increase with age. Approximately 4% of men in their 40s, 17% of men in their 60s, and 47% of men older than 75 experience chronic ED.
Causes for ED are primarily due to medical conditions, including diabetes, kidney disease, alcoholism, and atherosclerosis (build-up of plaque in the arteries). Plaque is made up of fat, cholesterol, calcium and other substances found in the blood. Over time plaque builds up, hardens, and restricts the blood flow in the arteries (NIH, 2014d). This build-up limits the flow of oxygenated blood to organs and the penis. Overall, diseases account for 70% of chronic ED, while psychological factors, such as stress, depression and anxiety account for 10%-20% of all cases. Many of these causes are treatable, and ED is not an inevitable result of aging. 327
Men during middle adulthood may also experience prostate enlargement, which can interfere with urination, and deficient testosterone levels which decline throughout adulthood, but especially after age 50. If testosterone levels decline significantly, it is referred to as andropause or late-onset hypogonadism. Identifying whether testosterone levels are low is difficult because individual blood levels vary greatly. Low testosterone is not a concern unless it accompanied by negative symptoms such as low sex drive, ED, fatigue, loss of muscle, loss of body hair, or breast enlargement. Low testosterone is also associated with medical conditions, such as diabetes, obesity, high blood pressure, and testicular cancer. The effectiveness of supplemental testosterone is mixed, and long term testosterone replacement therapy for men can increase the risk of prostate cancer, blood clots, heart attack and stroke (WebMD, 2016). Most men with low testosterone do not have related problems (Berkeley Wellness, 2011).
8.1.8 The Climacteric and Sexuality
Sexuality is an important part of people’s lives at any age, and many older adults are very interested in staying sexually active (Dimah & Dimah, 2004). According to the National Survey of Sexual Health and Behavior (NSSHB) (Center for Sexual Health Promotion, 2010), 74% of males and 70% of females aged 40-49 engaged in vaginal intercourse during the previous year, while 58% of males and 51% of females aged 50-59 did so.
Despite these percentages indicating that middle adults are sexually active, age-related physical changes can affect sexual functioning. For women, decreased sexual desire and pain during vaginal intercourse because of menopausal changes have been identified (Schick et al., 2010). A woman may also notice less vaginal lubrication during arousal which can affect overall pleasure (Carroll, 2016). Men may require more direct stimulation for an erection and the erection may be delayed or less firm (Carroll, 2016). As previously discussed men may experience erectile dysfunction or experience a medical conditions (such as diabetes or heart disease) that impact sexual functioning. Couples can continue to enjoy physical intimacy and may engage in more foreplay, oral sex, and other forms of sexual expression rather than focusing as much on sexual intercourse.
Risk of pregnancy continues until a woman has been without menstruation for at least 12 months, however, and couples should continue to use contraception. People continue to be at risk of contracting sexually transmitted infections, such as genital herpes, chlamydia, and genital warts. In 2014, 16.7% of the country’s new HIV diagnoses (7,391 of 44,071) were among people 50 and older, according to the Centers for Disease Control and Prevention (2014e). This was an increase from 15.4% in 2005. Practicing safe sex is important at any age, but unfortunately adults over the age of 40 have the lowest rates of condom use (Center for Sexual Health Promotion, 2010). This low rate of condom use suggests the need to enhance education efforts for older individuals regarding STI risks and prevention. Hopefully, when partners understand how aging affects sexual expression, they will be less likely to misinterpret these changes as a lack of sexual interest or displeasure in the partner and more able to continue to have satisfying and safe sexual relationships.
8.1.9 Brain Functioning
The brain at midlife has been shown to not only maintain many of the abilities of young adults, but also gain new ones. Some individuals in middle age actually have improved cognitive functioning (Phillips, 2011). The brain continues to demonstrate plasticity and rewires itself in middle age based on experiences. Research has demonstrated that older adults use more of their brains than younger adults. In fact, older adults who perform the best on tasks are more likely to demonstrate bilateralization than those who perform worst. Additionally, the amount of white matter in the brain, which is responsible for forming connections among neurons, increases into the 50s before it declines.
Emotionally, the middle aged brain is calmer, less neurotic, more capable of managing emotions, and better able to negotiate social situations (Phillips, 2011). Older adults tend to focus more on positive information and less on negative information than those younger. In fact, they also remember positive images better than those younger. Additionally, the older adult’s amygdala responds less to negative stimuli. Lastly, adults in middle adulthood make better financial decisions, which seems to peak at age 53, and show better economic understanding. Although greater cognitive variability occurs among middle adults when compared to those both younger and older, those in midlife with cognitive improvements tend to be more physically, cognitively, and socially active.
8.2 Cognitive Development in Middle Adulthood
Describe crystalized versus fluid intelligence
Describe research from the Seattle Longitudinal Study
Explain the importance of flow to creativity and life satisfaction
Describe how middle adults are turning to college for advanced training
Describe the difference between an expert and a novice
Describe the changes in the U.S. work force, especially among middle adults
Explain the importance of leisure to mental health and a successful retirement
8.2.1 Crystalized versus Fluid Intelligence
Intelligence is influenced by heredity, culture, social contexts, personal choices, and certainly age. One distinction in specific intelligences noted in adulthood, is between fluid intelligence, which refers to the capacity to learn new ways of solving problems and performing activities quickly and abstractly, and crystallized intelligence, which refers to the accumulated knowledge of the world we have acquired throughout our lives (Salthouse, 2004). These intelligences are distinct, and crystallized intelligence increases with age, while fluid intelligence tends to decrease with age (Horn, Donaldson, & Engstrom, 1981; Salthouse, 2004).
Research demonstrates that older adults have more crystallized intelligence as reflected in semantic knowledge, vocabulary, and language. As a result, adults generally outperform younger people on measures of history, geography, and even on crossword puzzles, where this information is useful (Salthouse, 2004). It is this superior knowledge, combined with a slower and more complete processing style, along with a more sophisticated understanding of the workings of the world around them, that gives older adults the advantage of “wisdom” over the advantages of fluid intelligence which favor the young (Baltes, Staudinger, & Lindenberger, 1999; Scheibe, Kunzmann, & Baltes, 2009).
The differential changes in crystallized versus fluid intelligence help explain why older adults do not necessarily show poorer performance on tasks that also require experience (i.e., crystallized intelligence), although they show poorer memory overall. A young chess player may think more quickly, for instance, but a more experienced chess player has more knowledge to draw on.
Seattle Longitudinal Study: The Seattle Longitudinal Study has tracked the cognitive abilities of adults since 1956. Every seven years the current participants are evaluated, and new individuals are also added. Approximately 6000 people have participated thus far, and 26 people from the original group are still in the study today. Current results demonstrate that middle-aged adults perform better on four out of six cognitive tasks than those same individuals did when they were young adults. Verbal memory, spatial skills, inductive reasoning (generalizing from particular examples), and vocabulary increase with age until one’s 70s (Schaie, 2005; Willis & Shaie, 1999). However, numerical computation and perceptual speed decline in middle and late adulthood (see Figure 8.18).
Cognitive skills in the aging brain have been studied extensively in pilots, and similar to the Seattle Longitudinal Study results, older pilots show declines in processing speed and memory capacity, but their overall performance seems to remain intact. According to Phillips (2011) researchers tested pilots age 40 to 69 as they performed on flight simulators. Older pilots took longer to learn to use the simulators but performed better than younger pilots at avoiding collisions.
Flow is the mental state of being completely present and fully absorbed in a task (Csikszentmihalyi, 1990). When in a state of flow, the individual is able to block outside distractions and the mind is fully open to producing. Additionally, the person is achieving great joy or intellectual satisfaction from the activity and accomplishing a goal. Further, when in a state of flow, the individual is not concerned with extrinsic rewards. Csikszentmihalyi (1996) used his theory of flow to research how some people exhibit high levels of creativity as he believed that a state of flow is an important factor to creativity (Kaufman & Gregoire, 2016). Other characteristics of creative people identified by Csikszentmihalyi (1996) include curiosity and drive, a value for intellectual endeavors, and an ability to lose our sense of self and feel a part of something greater. In addition, he believed that the tortured creative person was a myth and that creative people were very happy with their lives. According to Nakamura and Csikszentmihalyi (2002) people describe flow as the height of enjoyment. The more they experience it, the more they judge their lives to be gratifying. The qualities that allow for flow are well-developed in middle adulthood.
Tacit knowledge is knowledge that is pragmatic or practical and learned through experience rather than explicitly taught, and it also increases with age (Hedlund, Antonakis, & Sternberg, 2002). Tacit knowledge might be thought of as “know-how” or “professional instinct.” It is referred to as tacit because it cannot be codified or written down. It does not involve academic knowledge, rather it involves being able to use skills and to problem-solve in practical ways. Tacit knowledge can be understood in the workplace and used by blue collar workers, such as carpenters, chefs, and hair dressers.
8.2.2 Middle Adults Returning to Education
Midlife adults in the United States often find themselves in college classrooms. In fact, the rate of enrollment for older Americans entering college, often part-time or in the evenings, is rising faster than traditionally aged students. Students over age 35, accounted for 17% of all college and graduate students in 2009, and are expected to comprise 19% of that total by 2020 (Holland, 2014). In some cases, older students are developing skills and expertise in order to launch a second career, or to take their career in a new direction. Whether they enroll in school to sharpen particular skills, to retool and reenter the workplace, or to pursue interests that have previously been neglected, older students tend to approach the learning process differently than younger college students (Knowles, Holton, & Swanson, 1998).

The mechanics of cognition, such as working memory and speed of processing, gradually decline with age. However, they can be easily compensated for through the use of higher order cognitive skills, such as forming strategies to enhance memory or summarizing and comparing ideas rather than relying on rote memorization (Lachman, 2004). Although older students may take a bit longer to learn material, they are less likely to forget it quickly. Adult learners tend to look for relevance and meaning when learning information. Older adults have the hardest time learning material that is meaningless or unfamiliar. They are more likely to ask themselves, “Why is this important?” when being introduced to information or when trying to memorize concepts or facts. Older adults are more task-oriented learners and want to organize their activity around problem-solving.
Rubin et al. (2018) surveyed university students aged 17-70 regarding their satisfaction and approach to learning in college. Results indicated that older students were more independent, inquisitive, and motivated intrinsically compared to younger students. Additionally, older women processed information at a deeper learning level and expressed more satisfaction with their education.
To address the educational needs of those over 50, The American Association of Community Colleges (2016) developed the Plus 50 Initiative that assists community college in creating or expanding programs that focus on workforce training and new careers for the plus-50 population. Since 2008 the program has provided grants for programs to 138 community colleges affecting over 37, 000 students. The participating colleges offer workforce training programs that prepare 50 plus adults for careers in such fields as early childhood educators, certified nursing assistants, substance abuse counselors, adult basic education instructors, and human resources specialists. These training programs are especially beneficial as 80% of people over the age of 50 say they will retire later in life than their parents or continue to work in retirement, including in a new field.
8.2.3 Gaining Expertise: The Novice and the Expert
Expertise refers to specialized skills and knowledge that pertain to a particular topic or activity. In contrast, a novice is someone who has limited experiences with a particular task. Everyone develops some level of “selective” expertise in things that are personally meaningful to them, such as making bread, quilting, computer programming, or diagnosing illness. Expert thought is often characterized as intuitive, automatic, strategic, and flexible.
Intuitive: Novices follow particular steps and rules when problem solving, whereas experts can call upon a vast amount of knowledge and past experience. As a result, their actions appear more intuitive than formulaic. Novice cooks may slavishly follow the recipe step by step, while chefs may glance at recipes for ideas and then follow their own procedure.
Automatic: Complex thoughts and actions become more routine for experts. Their reactions appear instinctive over time, and this is because expertise allows us to process information faster and more effectively (Crawford & Channon, 2002).
Strategic: Experts have more effective strategies than non-experts. For instance, while both skilled and novice doctors generate several hypotheses within minutes of an encounter with a patient, the more skilled clinicians’ conclusions are likely to be more accurate. In other words, they generate better hypotheses than the novice. This is because they are able to discount misleading symptoms and other distractors and hone in on the most likely problem the patient is experiencing (Norman, 2005). Consider how your note taking skills may have changed after being in school over a number of years. Chances are you do not write down everything the instructor says, but the more central ideas. You may have even come up with your own short forms for commonly mentioned words in a course, allowing you to take down notes faster and more efficiently than someone who may be a novice academic note taker.
Flexible: Experts in all fields are more curious and creative; they enjoy a challenge and experiment with new ideas or procedures. The only way for experts to grow in their knowledge is to take on more challenging, rather than routine tasks.
Expertise takes time. It is a long-process resulting from experience and practice (Ericsson, Feltovich, & Prietula, 2006). Middle-aged adults, with their store of knowledge and experience, are likely to find that when faced with a problem they have likely faced something similar before. This allows them to ignore the irrelevant and focus on the important aspects of the issue. Expertise is one reason why many people often reach the top of their career in middle adulthood.
However, expertise cannot fully make-up for all losses in general cognitive functioning as we age. The superior performance of older adults in comparison to younger novices appears to be task specific (Charness & Krampe, 2006). As we age, we also need to be more deliberate in our practice of skills in order to maintain them. Charness and Krampe (2006) in their review of the literature on aging and expertise, also note that the rate of return for our effort diminishes as we age. In other words, increasing practice does not recoup the same advances in older adults as similar efforts do at younger ages.
8.2.4 Work at Midlife
Who is the U.S. workforce? The civilian, non-institutionalized workforce; the population of those aged 16 and older, who are employed has steadily declined since it reached its peak in the late 1990s, when 67% of the civilian workforce population was employed. In 2012 the rate had dropped to 64% and by 2019 it declined to 62.9% (Bureau of Labor Statistics, 2019). The U.S. population is expected to grow more slowly based on census projections for the next few years. Those new entrants to the labor force, adults age 16 to 24, are the only population of adults that will shrink in size over the next few years by nearly half a percent, while those age 55 and up will grow by 2.3% over current rates, and those age 65 to 74 will grow by nearly 4% (Monthly Labor Review (MLR), 2013). In 1992, 26% of the population was 55+, by 2022 it is projected to be 38%. Table 8.8 shows the rates of employment by age. In 2002, baby boomers were between the ages of 38 to 56, the prime employment group. In 2012, the youngest baby boomers were 48 and the oldest had just retired (age 66). These changes might explain some of the steady decline in work participation as this large population cohort ages out of the workforce. 334
In 2012, 53% of the workforce was male. For both genders and for most age groups the rate of participation in the labor force has declined from 2002 to 2012, and it is projected to decline further by 2022. The exception is among the older middle-age groups (the baby boomers), and especially for women 55 and older.
| Males | Females | |||||
| 2002 | 2012 | 2022* | 2002 | 2012 | 2022* | |
| 16-19 | 47.5 | 34 | 27.8 | 47.3 | 34.6 | 26.7 |
| 20-24 | 80.7 | 74.5 | 69.9 | 72.1 | 67.4 | 64.7 |
| 25-34 | 92.4 | 89.5 | 88.8 | 75.1 | 74.1 | 73.4 |
| 35-44 | 92.1 | 90.7 | 90.4 | 76.4 | 74.8 | 73.3 |
| 45-54 | 88.5 | 86.1 | 85.1 | 76 | 74.7 | 74.9 |
| 55-59 | 78 | 78 | 77.8 | 63.8 | 67.3 | 73.3 |
| 60-64 | 57.6 | 60.5 | 64.3 | 44.1 | 50.4 | 55.6 |
| 16+ totals | 74.1 | 70.2 | 67.6 | 59.6 | 57.7 | 56 |
*Projected rates of employment (adapted from Monthly Labor Review, 2013).
Hispanic males have the highest rate of participation in the labor force. In 2012, 76% of Hispanic males, compared with 71% of White, 72% of Asian, and 64% of Black men ages 16 or older were employed. Among women, Black women were more likely to be participating in the workforce (58%) compared with almost 57% of Hispanic and Asian, and 55% of White females. The rates for all racial and ethnic groups are expected to decline by 2022 (MLR, 2013).
Climate in the Workplace for Middle-aged Adults: A number of studies have found that job satisfaction tends to peak in middle adulthood (Besen, Matz-Costa, Brown, Smyer, & Pitt-Catsouphers, 2013; Easterlin, 2006). This satisfaction stems from not only higher wages, but often greater involvement in decisions that affect the workplace as they move from worker to supervisor or manager. Job satisfaction is also influenced by being able to do the job well, and after years of experience at a job many people are more effective and productive. Another reason for this peak in job satisfaction is that at midlife many adults lower their expectations and goals (Tangri, Thomas, & Mednick, 2003). Middle-aged employees may realize they have reached the highest they are likely to in their career. This satisfaction at work translates into lower absenteeism, greater productivity, and less job hopping in comparison to younger adults (Easterlin, 2006).
However, not all middle-aged adults are happy in the work place. Women may find themselves up against the glass ceiling. This may explain why females employed at large corporations are twice as likely to quit their jobs as are men (Barreto, Ryan, & Schmitt, 2009). Another problem older workers may encounter is job burnout, defined as unsuccessfully managed work place stress (World Health Organization, 2019). Burnout consists of:
Feelings of energy depletion or exhaustion
Increased mental distance from one’s job, or feelings of job negativism or cynicism
Reduced professional efficacy
American workers may experience more burnout than do workers in many other developed nations, because most developed nations guarantee by law a set number of paid vacation days (International Labour Organization, ILO, 2011), the United States does not (U.S. Department of Labor, 2016).
Not all employees are covered under overtime pay laws (U.S. Department of Labor, 2016). This is important when you considered that the 40-hour work week is a myth for most Americans. Only 4 in 10 U.S. workers work the typical 40-hour work week. The average work week for many is almost a full day longer (47 hours), with 39% working 50 or more hours per week (Saad, 2014). In comparision to workers in many other developed nations, American workers work more hours per year (Organisation for Economic Cooperation and Development, OECD, 2016). As can be seen in Figure 8.20, Americans work more hours than most European nations, especially western and northern Europe, althouigh they work less hours than workers in other nations, especially Mexico.
Challenges in the Workplace for Middle-aged Adults: In recent years middle aged adults have been challenged by economic downturns, starting in 2001, and again in 2008. Fifty-five percent of adults reported some problems in the workplace, such as fewer hours, pay-cuts, having to switch to part-time, etc., during the most recent economic recession (see Figure 8.21, Pew Research Center, 2010a). While young adults took the biggest hit in terms of levels of unemployment, middle-aged adults also saw their overall financial resources suffer as their retirement nest eggs disappeared and house values shrank, while foreclosures increased (Pew Research Center, 2010b). Not surprisingly this age group reported that the recession hit them worse than did other age groups, especially those age 50-64. Middle aged adults who find themselves unemployed are likely to remain unemployed longer than those in early adulthood (U.S. Government Accountability Office, 2012). In the eyes of employers, it may be more cost effective to hire a young adult, despite their limited experience, as they would be starting out at lower levels of the pay scale. In addition, hiring someone who is 25 and has many years of work ahead of them versus someone who is 55 and will likely retire in 10 years may also be part of the decision to hire a younger worker (Lachman, 2004). American workers are also competing with global markets and changes in technology. Those who are able to keep up with all these changes or are willing to uproot and move around the country or even the world have a better chance of finding work. The decision to move may be easier for people who are younger and have fewer obligations to others.
8.2.5 Leisure
As most developed nations restrict the number of hours an employer can demand that an employee work per week, and require employers to offer paid vacation time, what do middle aged adults do with their time off from work and duties, referred to as leisure? Around the world the most common leisure activity in both early and middle adulthood is watching television (Marketing Charts Staff, 2014). On average, middle aged adults spend 2-3 hours per day watching TV (Gripsrud, 2007) and watching TV accounts for more than half of all the leisure time (see Figure 8.22).
In the United States, men spend about 5 hours more per week in leisure activities, especially on weekends, than do women (Drake, 2013; U.S. Bureau of Labor Statistics, 2016). The leisure gap between mothers and fathers is slightly smaller, about 3 hours a week, than among those without children under age 18 (Drake, 2013). Those age 35-44 spend less time on leisure activities than any other age group, 15 or older (U.S. Bureau of Labor Statistics, 2016). This is not surprising as this age group are more likely to be parents and still working up the ladder of their career, so they may feel they have less time for leisure.
Americans have less leisure time than people in many other developed nations. As you read earlier, there are no laws in many job sectors guaranteeing paid vacation time in the United States (see Figure 8.23). Ray, Sanes and Schmitt (2013) report that several other nations also provide additional time off for young and older workers and for shift workers. In the United States, those in higher paying jobs and jobs covered by a union contract are more likely to have paid vacation time and holidays (Ray & Schmitt, 2007).
But do U.S. workers take their time off? According to Project Time-Off (2016), 55% of U.S. workers in 2015 did not take all of their paid vacation and holiday leave. A large percentage of this leave is lost. It cannot be rolled-over into the next year or paid out. A total of 658 million vacation days, or an average of 2 vacation days per worker was lost in 2015. The reasons most often given for not taking time off was worry that there would be a mountain of work to return to (40%), concern that no one else could do the job (35%), not being able to afford a vacation (33%), feeling it was harder to take time away when you have or are moving up in the company (33%), and not wanting to seem replaceable (22%). Since 2000, more American workers are willing to work for free rather than take the time that is allowed to them. A lack of support from their boss and even their colleagues to take a vacation is often a driving force in deciding to forgo time off. In fact, 80% of the respondents to the survey above said they would take time away if they felt they had support from their boss. Two-thirds reported that they hear nothing, mixed messages, or discouraging remarks about taking their time off. Almost a third (31%) feel they should contact their workplace, even while on vacation.
The benefits of taking time away from work: Several studies have noted the benefits of taking time away from work. It reduces job stress burnout (Nimrod, Kleiber, & Berdychevesky, 2012), improves both mental health (Qian, Yarnal, & Almeida, 2013) and physical health (Stern & Konno, 2009), especially if that leisure time also includes moderate physical activity (Lee et al., 2015). Leisure activities can also improve productivity and job satisfaction (Kühnel & Sonnentag, 2011) and help adults deal with balancing family and work obligations (Lee, et al., 2015).
8.3 Psychosocial Development in Middle Adulthood
Explain the controversy surrounding the concept of a midlife crisis
Explain the sources of stress confronting adults in midlife and the strategies to cope
Summarize Erikson’s seventh psychosocial task of generativity vs stagnation
Describe the relationships middle-aged adults have with their children, parents, and other family members
Describe singlehood, marriage, divorce, and remarriage at midlife
Describe the contemporary roles of grandparents
Describe friendships at midlife
Explain how women are uniquely affected at midlife
Explain the role of religion at midlife
There are many socioemotional changes that occur in how middle-aged adults perceive themselves. While people in their early 20s may emphasize how old they are to gain respect or to be viewed as experienced, by the time people reach their 40s they tend to emphasize how young they are. For instance, few 40 year olds cut each other down for being so young stating: “You’re only 43? I’m 48!” A previous focus on the future gives way to an emphasis on the present. Neugarten (1968) notes that in midlife, people no longer think of their lives in terms of how long they have lived. Rather, life is thought of in terms of how many years are left.
8.3.1 Midlife Crisis?
In 1978 Daniel Levinson published a book entitled The Seasons of a Man’s Life in which he presented a theory of development in adulthood. Levinson’s work was based on in-depth interviews with 40 men between the ages of 35-45. Levinson (1978) indicated that adults go through stages and have an image of the future that motivates them. This image is called “the dream” and for the men interviewed, it was a dream of how their career paths would progress and where they would be at midlife. According to Levinson the midlife transition (40-45) was a time of reevaluating previous commitments; making dramatic changes if necessary; giving expression to previously ignored talents or aspirations; and feeling more of a sense of urgency about life and its meaning. By the time the men entered middle adulthood (45-50), they believed they committed to the new choices made and placed one’s energies into these commitments.
Levinson believed that a midlife crisis was a normal part of development as the person is more aware of how much time has gone by and how much time is left. The future focus of early adulthood gives way to an emphasis on the present in midlife, and the men interviewed had difficulty reconciling the “dream” they held about the future with the reality they experienced. Consequently, they felt impatient and were no longer willing to postpone the things they had always wanted to do. Although Levinson believed his research demonstrated the existence of a midlife crisis, his study has been criticized for his research methods, including small sample size, similar ages, and concerns about a cohort effect. In fact, other research does not support his theory of the midlife crisis.
Vaillant (2012) believed that it was the cross-sectional design of Levinson’s study that led to the erroneous conclusion of an inevitable midlife crisis. Instead, he believed that longitudinal studies of an individual’s entire life was needed to determine the factors associated with optimum health and potential. Vaillant was one of the main researchers in the 75 year-old Harvard Study of Adult Development, and he considered a midlife crisis to be a rare occurrence among the participants (Vaillant, 1977). Additional findings of this longitudinal study will be discussed in the next chapter on late adulthood.
Most research suggests that most people in the United States today do not experience a midlife crisis. Results of a 10-year study conducted by the MacArthur Foundation Research Network on Successful Midlife Development, based on telephone interviews with over 3,000 midlife adults, suggest that the years between 40 and 60 are ones marked by a sense of well-being. Only 23% of their participants reported experiencing a midlife crisis. The crisis tended to occur among the highly educated and was triggered by a major life event rather than out of a fear of aging (Research Network on Successful Midlife Development, 2007).
8.3.2 Stress
We all know that stress plays a major role in our mental and physical health, but what exactly is stress? The term stress is defined as a pattern of physical and psychological responses in an organism after it perceives a threatening event that disturbs its homeostasis and taxes its abilities to cope with the event (Hooker & Pressman, 2016). Stress was originally derived from the field of mechanics where it is used to describe materials under pressure. The word was first used in a psychological manner by researcher Hans Selye, who was examining the effect of an ovarian hormone that he thought caused sickness in a sample of rats. Surprisingly, he noticed that almost any injected hormone produced this same sickness. He smartly realized that it was not the hormone under investigation that was causing these problems, but instead the aversive experience of being handled and injected by researchers led to high physiological arousal, and eventually to health problems like ulcers.
Selye (1946) coined the term stressor to label a stimulus that had this effect on the body (that is, causing stress). He developed a model of the stress response called the General Adaptation Syndrome, which is a three-phase model of stress, which includes a mobilization of physiological resources phase, a coping phase, and an exhaustion phase (i.e., when an organism fails to cope with the stress adequately and depletes its resources). Figure 8.25 illustrates the General Adaptation Syndrome.
Psychologists have studied stress in a myriad of ways, and it is not just major life stressor (e.g., a family death, a natural disaster) that increase the likelihood of getting sick. Stress can result from negative events, chronically difficult situations, a biological fight-or-flight response, and as clinical illness, such as post-traumatic stress disorder (PTSD). Even small daily hassles, like getting stuck in traffic or fighting with your friend, can raise your blood pressure, alter your stress hormones, and even suppress your immune system function (DeLongis, Folkman, & Lazarus, 1988; Twisk, Snel, Kemper, & van Machelen, 1999). Stress continues to be one of the most important and well-studied psychological correlates of illness, because excessive stress causes potentially damaging wear and tear on the body and can influence almost any disease process.
Dispositions and Stress: Negative dispositions and personality traits have been strongly tied to an array of health risks. One of the earliest negative trait-to-health connections was discovered in the 1950s by two cardiologists. They made the interesting discovery that there were common behavioral and psychological patterns among their heart patients that were not present in other patient samples. This pattern included being competitive, impatient, hostile, and time urgent. They labeled it Type A Behavior. Importantly, it was found to be associated with double the risk of heart disease as compared with Type B Behavior (absence of Type A behaviors) (Friedman & Rosenman, 1959). Since the 1950s, researchers have discovered that it is the hostility and competitiveness components of Type A that are especially harmful to heart health (Iribarren et al., 2000; Matthews, Glass, Rosenman, & Bortner, 1977; Miller, Smith, Turner, Guijarro, & Hallet, 1996). Hostile individuals are quick to get upset, and this angry arousal can damage the arteries of the heart. In addition, given their negative personality style, hostile people often lack a heath-protective supportive social network.
Social Relationships and Stress: Research has shown that the impact of social isolation on our risk for disease and death is similar in magnitude to the risk associated with smoking regularly (Holt-Lunstad, Smith, & Layton, 2010; House, Landis, & Umberson, 1988). In fact, the importance of social relationships for our health is so significant that some scientists believe our body has developed a physiological system that encourages us to seek out our relationships, especially in times of stress (Taylor et al., 2000). Social integration is the concept used to describe the number of social roles that you have (Cohen & Willis, 1985). For example, you might be a daughter, a basketball team member, a Humane Society volunteer, a coworker, and a student. Maintaining these different roles can improve your health via encouragement from those around you to maintain a healthy lifestyle. Those in your social network might also provide you with social support (e.g., when you are under stress). This support might include emotional help (e.g., a hug when you need it), tangible help (e.g., lending you money), or advice. By helping to improve health behaviors and reduce stress, social relationships can have a powerful, protective impact on health, and in some cases, might even help people with serious illnesses stay alive longer (Spiegel, Kraemer, Bloom, & Gottheil, 1989).
Caregiving and Stress: A disabled child, spouse, parent, or other family member is part of the lives of some midlife adults. According to the National Alliance for Caregiving (2015), 40 million Americans provide unpaid caregiving. The typical caregiver is a 49 year-old female currently caring for a 69 year-old female who needs care because of a long-term physical condition. Looking more closely at the age of the recipient of caregiving, the typical caregiver for those 18-49 years of age is a female (61%) caring mostly for her own child (32%) followed by a spouse or partner (17%). When looking at older recipients (50+) who receive care, the typical caregiver is female (60%) caring for a parent (47%) or spouse (10%).
Caregiving places enormous stress on the caregiver. Caregiving for a young or adult child with special needs was associated with poorer global health and more physical symptoms among both fathers and mothers (Seltzer, Floyd, Song, Greenberg, & Hong, 2011). Marital relationships are also a factor in how the caring affects stress and chronic conditions. Fathers who were caregivers identified more chronic health conditions than non-caregiving fathers, regardless of marital quality. In contrast, caregiving mothers reported higher levels of chronic conditions when they reported a high level of marital strain (Kang & Marks, 2014). Age can also make a difference in how one is affected by the stress of caring for a child with special needs. Using data from the Study of Midlife in the Unites States, Ha, Hong, Seltzer and Greenberg (2008) found that older parents were significantly less likely to experience the negative effects of having a disabled child than younger parents. They concluded that an age-related weakening of the stress occurred over time. This follows with the greater emotional stability noted at midlife.
Currently 25% of adult children, mainly baby boomers, provide personal or financial care to a parent (Metlife, 2011). Daughters are more likely to provide basic care and sons are more likely to provide financial assistance. Adult children 50+ who work and provide care to a parent are more likely to have fair or poor health when compared to those who do not provide care. Some adult children choose to leave the work force, however, the cost of leaving the work force early to care for a parent is high. For females, lost wages and social security benefits equals $324,044, while for men it equals $283,716 (Metlife, 2011). This loss can jeopardize the adult child’s financial future. Consequently, there is a need for greater workplace flexibility for working caregivers.
Spousal Care: Certainly, caring for a disabled spouse would be a difficult experience that could negatively affect one’s health. However, research indicates that there can be positive health effect for caring for a disabled spouse. Beach, Schulz, Yee and Jackson (2000) evaluated health related outcomes in four groups: Spouses with no caregiving needed (Group 1), living with a disabled spouse but not providing care (Group 2), living with a disabled spouse and providing care (Group 3), and helping a disabled spouse while reporting caregiver strain, including elevated levels of emotional and physical stress (Group 4). Not surprisingly, the participants in Group 4 were the least healthy and identified poorer perceived health, an increase in health-risk behaviors, and an increase in anxiety and depression symptoms. However, those in Group 3 who provided care for a spouse, but did not identify caregiver strain, actually identified decreased levels of anxiety and depression compared to Group 2 and were actually similar to those in Group 1. It appears that greater caregiving involvement was related to better mental health as long as the caregiving spouse did not feel strain. The beneficial effects of helping identified by the participants were consistent with previous research (Krause, Herzog, & Baker, 1992; Schulz et al., 1997).
When caring for a disabled spouse, gender differences have also been identified. Female caregivers of a spouse with dementia experienced more burden, had poorer mental and physical health, exhibited increased depressive symptomatology, took part in fewer health-promoting activities, and received fewer hours of help than male caregivers (Gibbons et al., 2014). This study was consistent with previous research findings that women experience more caregiving burden than men, despite similar caregiving situations (Torti, Gwyther, Reed, Friedman, & Schulman, 2004; Yeager, Hyer, Hobbs, & Coyne, 2010). Explanations for why women do not use more external support, which may alleviate some of the burden, include women’s expectations that they should assume caregiving roles (Torti et al, 2004) and their concerns with the opinions of others (Arai, Sugiura, Miura, Washio, & Kudo, 2000). Also contributing to women’s poorer caregiving outcomes is that disabled males are more aggressive than females, especially males with dementia who display more physical and sexual aggression toward their caregivers (Eastley & Wilcock, 1997; Zuidema, de Jonghe, Verhey, & Koopmans, 2009). Female caregivers are certainly at risk for negative consequences of caregiving, and greater support needs to be available to them.

Stress Management: On a scale from 1 to 10, those Americans aged 39-52 rated their stress at 5.3, and those aged 53-71 rated their stress at 3.9 (American Psychological Association, 2017). The most common sources of stress included the future of our nation, money, work, current political climate, and violence and crime. Given that these sources of our stress are often difficult to change, a number of interventions have been designed to help reduce the aversive responses to duress, especially related to health. For example, relaxation activities and forms of meditation are techniques that allow individuals to reduce their stress via breathing exercises, muscle relaxation, and mental imagery. Physiological arousal from stress can also be reduced via biofeedback, a technique where the individual is shown bodily information that is not normally available to them (e.g., heart rate), and then taught strategies to alter this signal. This type of intervention has even shown promise in reducing heart and hypertension risk, as well as other serious conditions (Moravec, 2008; Patel, Marmot, & Terry, 1981). Reducing stress does not have to be complicated. For example, exercise is a great stress reduction activity (Salmon, 2001) that has a myriad of health benefits.
Coping Strategies: Coping is often classified into two categories: Problem-focused coping or emotion-focused coping (Carver, Scheier, & Weintraub, 1989). Problem-focused coping is thought of as actively addressing the event that is causing stress in an effort to solve the issue at hand. For example, say you have an important exam coming up next week. A problem-focused strategy might be to spend additional time over the weekend studying to make sure you understand all of the material. Emotion-focused coping, on the other hand, regulates the emotions that come with stress. In the above examination example, this might mean watching a funny movie to take your mind off the anxiety you are feeling. In the short term, emotion-focused coping might reduce feelings of stress, but problem-focused coping seems to have the greatest impact on mental wellness (Billings & Moos, 1981; Herman-Stabl, Stemmler, & Petersen, 1995). That being said, when events are uncontrollable (e.g., the death of a loved one), emotion-focused coping directed at managing your feelings, at first, might be the better strategy. Therefore, it is always important to consider the match of the stressor to the coping strategy when evaluating its plausible benefits.
8.3.3 Erikson: Generativity vs Stagnation
According to Erikson (1950, 1982) generativity encompasses procreativity, productivity, and creativity. This stage includes the generation of new beings, new products, and new ideas, as well as self-generation concerned with further identity development. Erikson believed that the stage of generativity, during which one established a family and career, was the longest of all the stages. Individuals at midlife are primarily concerned with leaving a positive legacy of themselves, and parenthood is the primary generative type. Erikson understood that work and family relationships may be in conflict due to the obligations and responsibilities of each, but he believed it was overall a positive developmental time. In addition to being parents and working, Erikson also described individuals being involved in the community during this stage. A sense of stagnation occurs when one is not active in generative matters, however, stagnation can motive a person to redirect energies into more meaningful activities.
Erikson identified “virtues” for each of his eight stages, and the virtue emerging when one achieves generativity is “Care”. Erikson believed that those in middle adulthood should “take care of the persons, the products, and the ideas one has learned to care for” (Erikson, 1982, p. 67). Further, Erikson believed that the strengths gained from the six earlier stages are essential for the generational task of cultivating strength in the next generation. Erikson further argued that generativity occurred best after the individual had resolved issues of identity and intimacy (Peterson & Duncan, 2007).
Research has demonstrated that generative adults possess many positive characteristics, including good cultural knowledge and healthy adaptation to the world (Peterson & Duncan, 2007). Using the Big 5 personality traits, generative women and men scored high on conscientiousness, extraversion, agreeableness, openness to experience, and low on neuroticism (de St. Aubin & McAdams, 1995; Peterson, Smirles, & Wentworth, 1997). Additionally, women scoring high in generativity at age 52, were rated high in positive personality characteristics, satisfaction with marriage and motherhood, and successful aging at age 62 (Peterson & Duncan, 2007). Similarly, men rated higher in generativity at midlife were associated with stronger global cognitive functioning (e.g., memory, attention, calculation), stronger executive functioning (e.g., response inhibition, abstract thinking, cognitive flexibility), and lower levels of depression in late adulthood (Malone, Liu, Vaillant, Rentz, & Waldinger, 2016).
Erikson (1982) indicated that at the end of this demanding stage, individuals may withdraw as generativity is no longer expected in late adulthood. This releases elders from the task of care taking or working. However, not feeling needed or challenged may result in stagnation, and consequently one should not fully withdraw from generative tasks as they enter Erikson’s last stage in late adulthood. 345
8.3.4 Midlife Relationships
The sandwich generation refers to adults who have at least one parent age 65 or older and are either raising their own children or providing support for their grown children. According to a recent Pew Research survey, 47% of middle-aged adults are part of this sandwich generation (Parker & Patten, 2013). In addition, 15% of middle-aged adults are providing financial support to an older parent while raising or supporting their own children (see Figure 8.30). According to the same survey, almost half (48%) of middle-aged adults, have supported their adult children in the past year, and 27% are the primary source of support for their grown children.
Seventy-one percent of the sandwich generation is age 40-59, 19% were younger than 40, and 10% were 60 or older. Hispanics are more likely to find themselves supporting two generations; 31% have parents 65 or older and a dependent child, compared with 24% of whites and 21% of blacks (Parker & Patten, 2013). Women are more likely to take on the role of care provider for older parents in the U.S. and Germany (Pew Research, 2015). About 20% of women say they have helped with personal care, such as getting dressed or bathing, of aging parents in the past year, compared with 8% of men in the U.S. and 4% in Germany. In contrast, in Italy men are just as likely (25%) as women (26%) to have provided personal care.
The Pew survey found that almost 33% of the sandwich-generation adults were more likely to say they always feel rushed, while only 23% of other adults said this. However, the survey suggests that those who were supporting both parents and children reported being just as happy as those middle-aged adults who did not find themselves in the sandwich generation (Parker & Patten, 2013). Adults who are supporting both parents and children did report greater financial strain (see Figure 8.31). Only 28% reported that they were living comfortably versus 41% of those who were not also supporting their parents. Almost 33% were just making ends meet, compared with 17% of those who did not have the additional financial burden of aging parents.
Kinkeeping: At midlife adults may find themselves as a kinkeeper. In all families there is a person or persons who keep the family connected and who promote solidarity and continuity in the family (Brown & DeRycke, 2010). Who in your own family do you count on to organize family gatherings? Who knows the history of your family? Who do people turn to in your family for advice and support? Who works to strengthen the bonds between members of your family? These are your family’s kinkeepers, and they are usually women (Leach & Braithwaite, 1996; Brown & DeRycke, 2010). Leach and Braithwaite found that 86% of their respondents named a woman as their family’s kinkeeper, and Brown and DeRycke found that mothers, maternal grandmothers, and paternal grandmothers were more likely to be a family’s kinkeeper than were fathers, young adult children, and grandfathers combined. Brown and DeRycke also found that among young adults, women were more likely to be a kinkeeper than were young adult men.
Kinkeeping can be a source of distress when it interferes with other obligations (Gerstel & Gallagher, 1993). Gerstel and Gallagher found that on average, kinkeepers provide almost a full week of work each month to kinkeeping (almost 34 hours). They also found that the more activities the kinkeeper took on, and the more kin they helped the more stress and higher the levels of depression a kinkeeper experienced. However, unlike other studies on kinkeeping, Gerstel and Gallagher also included a number of activities that would be considered more “caregiving,” such as providing transportation, making repairs, providing meals, etc. in addition to the usual activities of kinkeeping.
Empty nest: The empty nest, or post-parental period refers to the time period when children are grown up and have left home (Dennerstein, Dudley & Guthrie, 2002). For most parents this occurs during midlife. This time is recognized as a “normative event” as parents are aware that their children will become adults and eventually leave home (Mitchell & Lovegreen, 2009). The empty nest creates complex emotions, both positive and negative, for many parents. Some theorists suggest this is a time of role loss for parents, others suggest it is one of role strain relief (Bouchard, 2013).
The role loss hypothesis predicts that when people lose an important role in their life they experience a decrease in emotional well-being. It is from this perspective that the concept of the empty nest syndrome emerged, which refers to great emotional distress experienced by parents, typically mothers, after children have left home. The empty nest syndrome is linked to the absence of alternative roles for the parent in which they could establish their identity (Borland, 1982). In Bouchard’s (2013) review of the research, she found that few parents reported loneliness or a big sense of loss once all their children had left home.
In contrast, the role stress relief hypothesis suggests that the empty nest period should lead to more positive changes for parents, as the responsibility of raising children has been lifted. The role strain relief hypothesis was supported by many studies in Bouchard’s (2013) review. A consistent finding throughout the research literature is that raising children has a negative impact on the quality of martial relationships (Ahlborg, Misvaer, & Möller, 2009; Bouchard, 2013). Most studies have reported that martial satisfaction often increases during the launching phase of the empty nest period, and that this satisfaction endures long after the last child has left home (Gorchoff, John, & Helson, 2008).
However, most of the research on the post-parental period has been with American parents. A number of studies in China suggest that empty-nesters, especially in more rural areas of China, report greater loneliness and depression than their counterparts with children still at home (Wu et al., 2010). Family support for the elderly by their children is a cherished Chinese tradition (Wong & Leung, 2012). With children moving from the rural communities to the larger cities for education and employment this may explain the more pessimistic reaction of Chinese parents than in American samples. The loss of an adult child in a rural region may mean a loss of family income for aging parents. Empty-nesters in urban regions of China did not report the same degree of distress (Su et al., 2012), suggesting that it not so much the event of children leaving, but the additional hardships this may place on aging parents.
Boomerang Kids: As you read in Chapter 7, young adults are living with their parents for a longer duration and in greater numbers than previous generations. In addition to those in early adulthood who are not leaving the home of their parents, there are also young adults who are returning after having lived independently outside the home, and these are called boomerang kids. Figure 8.32 shows the number of American young people 25-35 who were living at home based on their generation (Fry, 2017). Figure 8.33 shows that more young adults 18-34 in Europe are also living with their parents (Desilver, 2016). Many of the same financial reasons that are influencing young people’s decisions to delay exit from the home of their parents are underlying their decisions to return home. In addition, to financial reasons, some boomerang kids are returning because of emotional distress, such as mental health issues (Sandberg-Thoma, Snyder, & Jang, 2015).
What is the effect on parents when their adult children return home? Certainly, there is considerable research that shows that the stress of raising children can have a negative impact on parents’ well-being, and that when children leave home many couples experience less stress and greater life satisfaction (see the section on the empty nest). Early research in the 1980s and 1990s supported the notion that boomerang children, along with those who were failing to exit the home, placed greater financial hardship on the parents, and the parents reported more negative perceptions of this living arrangement (Aquilino, 1991). Recent surveys suggest that today’s parents are more tolerant of this, perhaps because this is becoming a more normative experience than in the past. Moreover, children who return are more likely to have had good relationships with their parents growing up, so there may be less stress between parents and their adult children who return (Sandberg-Thoma et al., 2015). Parents of young adults who have moved back home because of economic reasons report that they are just as satisfied with their life as are parents whose adult children are still living independently (Parker, 2012). Parker found that adult children age 25 and older are more likely to contribute financially to the family or complete chores and other household duties. Parker also found that living in a multigenerational household may be acting as an economic safety net for young adults. In comparison to young adults who were living outside of the home, those living with their parents were less likely to be living in poverty (17% versus 10%).
So far, we have considered the impact that adult children who have returned home or have yet to leave the nest have on the lives of middle-aged parents. What about the effect on parents who have adult children dealing with personal problems, such as alcoholism, chronic health concerns, mental health issues, trouble with the law, poor social relationships, or academic or job related problems, even if they are not living at home? The life course perspective proposes the idea of linked lives (Greenfield & Marks, 2006). The notion that people in important relationships, such as children and parents, mutually influence each other’s developmental pathways. In previous chapters you have read about the effects that parents have on their children’s development, but this relationship is bidirectional. The problems faced by children, even when those children are adults, influence the lives of their parents. Greenfield and Marks found in their study of middle-aged parents and their adult children, those parents whose children were dealing with personal problems reported more negative affect, lower self-acceptance, poorer parent-child interactions, and more family relationship stress. The more problems the adult children were facing, the worse the lives and emotional health of their parents, with single parents faring the worst.
8.3.5 Middle Adult Lifestyles
Singlehood: According to a Pew Research study, 16 per 1,000 adults age 45 to 54 and 7 per 1000 age 55 and over have never-married in the U. S. (Wang & Parker, 2014). However, some of them may be living with a partner. In addition, some singles at midlife may be single through divorce or widowhood. DePaulo (2014) has challenged the idea that singles, especially the always single, fair worse emotionally and in health when compared to those married. DePaulo suggests there is a bias in how studies examine the benefits of marriage. Most studies focus on comparisons between married versus not married, which do not include a separate comparison between those always single, and those who are single because of divorce or widowhood. Her research has found that those who are married may be more satisfied with life than the divorced or widowed, but there is little difference between married and always single, especially when comparing those who are recently married with those who have been married for four or more years. It appears that once the initial blush of the honeymoon wears off, those who are wedded are no happier or healthier than those who remained single. This might also suggest that there may be problems with how the “married” category is also seen as one homogeneous group. 349
Online Dating: Montenegro (2003) surveyed over 3,000 singles aged 40–69, and almost half of the participants reported their most important reason for dating was to have someone to talk to or do things with. Additionally, sexual fulfillment was also identified as an important goal for many. Alterovitz & Mendelsohn (2013) reviewed online personal ads for men and women over age 40 and found that romantic activities and sexual interests were mentioned at similar rates among the middle-age and young-old age groups, but less for the old-old age group.
Marriage: As you read in Chapter 7, there has been a number of changes in the marriage rate as more people are cohabitating, more are deciding to stay single, and more are getting married at a later age. As you can see in Figure 8.34, 48% of adults age 45-54 are married; either in their first marriage (22%) or have remarried (26%). This makes marriage the most common relationship status for middle-aged adults in the United States. Marital satisfaction tends to increase for many couples in midlife as children are leaving home (Landsford, Antonucci, Akiyama, & Takahashi, 2005). Not all researchers agree. They suggest that those who are unhappy with their marriage are likely to have gotten divorced by now, making the quality of marriages later in life only look more satisfactory (Umberson, Williams, Powers, Chen, & Campbell, 2005).
Divorce: Livingston (2014) found that 27% of adults age 45 to 54 were divorced (see Figure 8.32). Additionally, 57% of divorced adults were women. This reflects the fact that men are more likely to remarry than are women. Two-thirds of divorces are initiated by women (AARP, 2009). Most divorces take place within the first 5 to 10 years of marriage. This time line reflects people’s initial attempts to salvage the relationship. After a few years of limited success, the couple may decide to end the marriage. It used to be that divorce after having been married for 20 or more years was rare, but in recent years the divorce rate among more long-term marriages has been increasing. Brown and Lin (2013) note that while the divorce rate in the U.S. has declined since the 1990s, the rate among those 50 and older has doubled. They suggest several reasons for the “graying of divorce”. There is less stigma attached to divorce today than in the past. Some older women are out-earning their spouses, and thus may be more financially capable of supporting themselves, especially as most of their children have grown. Finally, given increases in human longevity, the prospect of living several more years or decades with an incompatible spouse may prompt middle-aged and older adults to leave the marriage. 350
Gottman and Levenson (2000) found that the divorces in early adulthood were angrier and conflictual, with each partner blaming the other for the failures in the marriage. In contrast, they found that at midlife divorces tended to be more about having grown apart, or a cooling off of the relationship. A survey by AARP (2009) found that men and women had diverse motivations for getting a divorce. Women reported concerns about the verbal and physical abusiveness of their partner (23%), drug/alcohol abuse (18%), and infidelity (17%). In contrast, men mentioned they had simply fallen out of love (17%), no longer shared interests or values (14%), and infidelity (14%). Both genders felt their marriage had been over long before the decision to divorce was made, with many of the middle-aged adults in the survey reporting that they stayed together because they were still raising children. Females also indicated that they remained in their marriage due to financial concerns, including the loss of health care (Sohn, 2015). However, only 1 in 4 adults regretted their decision to divorce.
The effects of divorce are varied. Overall, young adults struggle more with the consequences of divorce than do those at midlife, as they have a higher risk of depression or other signs of problems with psychological adjustment (Birditt & Antonucci, 2013). Divorce at midlife is more stressful for women. In the AARP (2009) survey, 44% of middle-aged women mentioned financial problems after divorcing their spouse, in comparison only 11% of men reported such difficulties. However, a number women who divorce in midlife report that they felt a great release from their day-to-day sense of unhappiness. Hetherington and Kelly (2002) found that among the divorce enhancers, those who had used the experience to better themselves and seek more productive intimate relationships, and the competent loners, those who used their divorce experience to grow emotionally, but who choose to stay single, the overwhelming majority were women.
Dating Post-Divorce: Most divorced adults have dated by one year after filing for divorce (Anderson et al., 2004; Anderson & Greene, 2011). One in four recent filers report having been in or were currently in a serious relationship, and over half were in a serious relationship by one year after filing for divorce. Not surprisingly, younger adults were more likely to be dating than were middle aged or older adults, no doubt due to the larger pool of potential partners from which they could to draw. Of course, these relationships will not all end in marriage. Teachman (2008) found that more than two thirds of women under the age of 45 had cohabited with a partner between their first and second marriages.
Dating for adults with children can be more of a challenge. Courtships are shorter in remarriage than in first marriages. When couples are “dating”, there is less going out and more time spent in activities at home or with the children. So the couple gets less time together to focus on their relationship. Anxiety or memories of past relationships can also get in the way. As one Talmudic scholar suggests “when a divorced man marries a divorced woman, four go to bed.” (Secombe & Warner, 2004).
Post-divorce parents gatekeep, that is, they regulate the flow of information about their new romantic partner to their children, in an attempt to balance their own needs for romance with consideration regarding the needs and reactions of their children. Anderson et al. (2004) found that almost half (47%) of dating parents gradually introduce their children to their dating partner, giving both their romantic partner and children time to adjust and get to know each other. Many parents who use this approach do so to avoid their children having to keep meeting someone new until it becomes clearer that this relationship might be more than casual. It might also help if the adult relationship is on firmer ground so it can weather any initial push back from children when it is revealed. Forty percent are open and transparent about the new relationship at the outset with their children. Thirteen percent do not reveal the relationship until it is clear that cohabitation and or remarriage is likely. Anderson and colleagues suggest that practical matters influence which gatekeeping method parents may use. Parents may be able to successfully shield their children from a parade of suitors if there is reliable childcare available. The age and temperament of the child, along with concerns about the reaction of the ex-spouse, may also influence when parents reveal their romantic relationships to their children.
Rates of remarriage: The rate for remarriage, like the rate for marriage, has been declining overall. In 2013 the remarriage rate was approximately 28 per 1,000 adults 18 and older. This represents a 44% decline since 1990 and a 16% decline since 2008 (Payne, 2015). Brown and Lin (2013) found that the rate of remarriage dropped more for younger adults than middle aged and older adults, and Livingston (2014) found that as we age we are more likely to have remarried (see Figure 8.35). This is not surprising as it takes some time to marry, divorce, and then find someone else to marry. However, Livingston found that unlike those younger than 55, those 55 and up are remarrying at a higher rate than in the past. In 2013, 67% of adults 55-64 and 50% of adults 65 and older had remarried, up from 55% and 34% in 1960, respectively.
Men have a higher rate of remarriage at every age group starting at age 25 (Payne, 2015). Livingston (2014) reported that in 2013, 64% of divorced or widowed men compared with 52% of divorced or widowed women had remarried. However, this gender gap has narrowed over time. Even though more men still remarry, they are remarrying at a slower rate. In contrast, women are remarrying today more than they did in 1980. This gender gap has closed mostly among young and middle aged adults, but still persists among those 65 and older.
In 2012, Whites who were previously married were more likely to remarry than were other racial and ethnic groups (Livingston, 2014). Moreover, the rate of remarriage has increased among Whites, while the rate of remarriage has declined for other racial and ethnic groups. This increase is driven by White women, whose rate of remarriage has increased, while the rate for White males has declined.
Success of Remarriage: Reviews are mixed as to the happiness and success of remarriages. While some remarriages are more successful, especially if the divorce motivated the adult to engage in self-improvement and personal growth (Hetherington & Kelly, 2002), a number of divorced adults end up in very similar marriages the second or third time around (Hetherington & Kelly, 2002). Remarriages have challenges that are not found in first marriages that may create additional stress in the marital relationship. There can often be a general lack of clarity in family roles and expectations when trying to incorporate new kin into the family structure, even determining the appropriate terms for these kin, along with their roles can be a challenge.
Partners may have to navigate carefully their role when dealing with their partners’ children. All of this may lead to greater dissatisfaction and even resentment among family members. Even though remarried couples tend to have more realistic expectations for marriage, they tend to be less willing to stay in unhappy situations. The rate of divorce among remarriages is higher than among first marriages (Payne, 2015), which can add additional burdens, especially when children are involved.
Children’s Influence on Repartnering: Does having children affect whether a parent remarries? Goldscheider and Sassler (2006) found children residing with their mothers reduces the mothers’ likelihood of marriage, only with respect to marrying a man without children. Further, having children in the home appears to increase single men’s likelihood of marrying a woman with children (Stewart, Manning, & Smock, 2003). There is also some evidence that individuals who participated in a stepfamily while growing up may feel better prepared for stepfamily living as adults. Goldscheider and Kaufman (2006) found that having experienced family divorce as a child is associated with a greater willingness to marry a partner with children.
When children are present after divorce, one of the challenges the adults encounter is how much influence the child will have when selecting a new partner. Greene, Anderson, Hetherington, Forgatch, and DeGarmo (2003) identified two types of parents. The child-focused parent allows the child’s views, reactions, and needs to influence the repartnering. In contrast, the adult-focused parent expects that their child can adapt and should accommodate to parental wishes. Anderson and Greene (2011) found that divorced custodial mothers identified as more adult focused tended to be older, more educated, employed, and more likely to have been married longer. Additionally, adult focused mothers reported having less rapport with their children, spent less time in joint activities with their children, and the child reported lower rapport with their mothers. Lastly, when the child and partner were resisting one another, adult- focused mothers responded more to the concerns of the partner, while the child focused mothers responded more to the concerns of the child. Understanding the implications of these two differing perspectives can assist parents in their attempts to repartner.
8.3.6 Grandparents
In addition to maintaining relationships with their children and aging parents, many people in middle adulthood take on yet another role, becoming a grandparent. The role of grandparent varies around the world. In multigenerational households, grandparents may play a greater role in the day-to-day activities of their grandchildren. While this family dynamic is more common in Latin America, Asia, and Africa, it has been on the increase in the U.S. (Pew Research Center, 2010). 353
The degree of grandparent involvement also depends on the proximity of the grandparents’ home to the grandchildren. In developed nations, the greater mobility of the society can mean that grandparents may live long distances from their grandchildren. Technology has brought grandparents and their more distant grandchildren together. Sorenson and Cooper (2010) found that many of the grandfathers they interviewed would text, email, or Skype with their grandchildren in order to stay in touch.
Cherlin and Furstenberg (1986) described three styles of grandparents. Thirty percent of grandparents were remote as they rarely saw their grandchildren. Usually they lived far away from the grandchildren but may also have had a distant relationship. Contact was typically made on special occasions, such as holidays or birthdays. Fifty-five percent of grandparents were described as companionate as they did things with their grandchildren but had little authority or control over them. They preferred to spend time with them without interfering in parenting. They were more like friends to their grandchildren. Fifteen percent of grandparents were described as involved as they took a very active role in their grandchild’s life. The involved grandparent had frequent contact with and authority over the grandchild, and their grandchildren might even have lived with them. Grandmothers, more so than grandfathers, played this role. In contrast, more grandfathers than grandmothers saw their role as family historian and family advisor (Neugarten and Weinstein, 1964).
Bengtson (2001) suggests that grandparents adopt different styles with different grandchildren, and over time may change styles as circumstances in the family change. Today more grandparents are the sole care providers for grandchildren or may step in at times of crisis. With these changes grandparents are redefining how they see their role in the family with fewer adopting a more formal role (Hayslip, Henderson & Shore, 2003).
Early research on grandparents has routinely focused on grandmothers, with grandfathers often becoming invisible members of the family (Sorensen & Cooper, 2010). Yet, grandfathers stress the importance of their relationships with their grandchildren as strongly as do grandmothers (Waldrop et al., 1999). For some men, this may provide them with the opportunity to engage in activities that their occupations, as well as their generation’s views of fatherhood and masculinity, kept them from engaging in with their own children (Sorenson & Cooper, 2010). Many of the grandfathers in Sorenson and Cooper’s study felt that being a grandfather was easier and a lot more enjoyable. Even among grandfathers that took on a more involved role, there was still a greater sense that they could be more light-hearted and flexible in their interactions with their grandchildren. Many grandfathers reported that they were more openly affectionate with their grandchildren than they had been with their own children.
8.3.7 Friendships
Adults of all ages who reported having a confidante or close friend with whom they could share personal feelings and concerns, believed these friends contributed to a sense of belonging, security, and overall wellbeing (Dunér & Nordstrom, 2007). Having a close friend is a factor in significantly lower odds of psychiatric morbidity including depression and anxiety (Harrison, Barrow, Gask, & Creed, 1999; Newton et al., 2008). The availability of a close friend has also been shown to lessen the adverse effects of stress on health (Kouzis & Eaton, 1998; Hawkley et al., 2008; Tower & Kasl, 1995). Additionally, poor social connectedness in adulthood is associated with a larger risk of premature mortality than cigarette smoking, obesity, and excessive alcohol use (Holt-Lunstad, Smith, & Layton, 2010).
Female friendships and social support networks at midlife contribute significantly to a woman’s feeling of life satisfaction and well-being (Borzumato-Gainey, Kennedy, McCabe, & Degges-White, 2009). Degges-White and Myers (2006) found that women who have supportive people in their life experience greater life satisfaction than do those who live a more solitary life. A friendship network or the presence of a confidant have both been identified for their importance to women’s mental health (Baruch & Brooks-Gunn, 1984). Unfortunately, with numerous caretaking responsibilities at home, it may be difficult for women to find time and energy to enhance the friendships that provide an increased sense of life satisfaction (Borzumato-Gainey et al., 2009). Emslie, Hunt and Lyons (2013) found that for men in midlife, the shared consumption of alcohol was important to creating and maintaining male friends. Drinking with friends was justified as a way for men to talk to each other, provide social support, relax, and improve mood. Although the social support provided when men drink together can be helpful, the role of alcohol in male friendships can lead to health damaging behavior from excessive drinking.

The importance of social relationships begins in early adulthood by laying down a foundation for strong social connectedness and facilitating comfort with intimacy (Erikson, 1959). To determine the impact of the quantity and quality of social relationships in young adulthood on middle adulthood, Carmichael, Reis, and Duberstein (2015) assessed individuals at age 50 on measures of social connection (types of relationships and friendship quality) and psychological outcomes (loneliness, depression, psychological well-being). Results indicated that the quantity of social interactions at age 20 and the quality, not quantity, of social interaction at age 30 predicted midlife social interactions. Those individuals who had high levels of social information seeking (quantity) at age 20 followed by less quantity in social relationships but greater emotional closeness (quality), resulted in positive psychosocial adjustment at midlife. Continuing to socialize widely in one’s 30s appeared to negatively affect the development of intimacy, and consequently resulted in worse psychological outcomes at age 50.
Internet Friendships: What influence does the Internet have on friendships? It is not surprising that people use the Internet with the goal of meeting and making new friends (Fehr, 2008; McKenna, 2008). Researchers have wondered if the issue of not being face-to-face reduces the authenticity of relationships, or if the Internet really allows people to develop deep, meaningful connections. Interestingly, research has demonstrated that virtual relationships are often as intimate as in-person relationships; in fact, Bargh and colleagues found that online relationships are sometimes more intimate (Bargh, McKenna, & Fitsimons, 2002). This can be especially true for those individuals who are more socially anxious and lonely as such individuals are more likely to turn to the Internet to find new and meaningful relationships (McKenna, Green, & Gleason, 2002). McKenna and colleagues suggest that for people who have a hard time meeting and maintaining relationships, due to shyness, anxiety, or lack of face-to-face social skills, the Internet provides a safe, nonthreatening place to develop and maintain relationships. Similarly, Benford (2008) found that for high-functioning autistic individuals, the Internet facilitated communication and relationship development with others, which would have been more difficult in face-to-face contexts, leading to the conclusion that Internet communication could be empowering for those who feel frustrated when communicating face to face.
Workplace Friendships: Friendships often take root in the workplace, due to the fact that people are spending as much, or more, time at work than they are with their family and friends (Kaufman & Hotchkiss, 2003). Often, it is through these relationships that people receive mentoring and obtain social support and resources, but they can also experience conflicts and the potential for misinterpretation when sexual attraction is an issue. Indeed, Elsesser and Peplau (2006) found that many workers reported that friendships grew out of collaborative work projects, and these friendships made their days more pleasant.
In addition to those benefits, Riordan and Griffeth (1995) found that people who worked in an environment where friendships could develop and be maintained were more likely to report higher levels of job satisfaction, job involvement, and organizational commitment, and they were less likely to leave that job. Similarly, a Gallup poll revealed that employees who had close friends at work were almost 50% more satisfied with their jobs than those who did not (Armour, 2007).
8.3.8 Women in Midlife
In Western society, aging for women is much more stressful than for men as society emphasizes youthful beauty and attractiveness (Slevin, 2010). The description that aging men are viewed as “distinguished” and aging women are viewed as “old” is referred to as the double standard of aging (Teuscher & Teuscher, 2006). Since women have traditionally been valued for their reproductive capabilities, they may be considered old once they are postmenopausal. In contrast, men have traditionally been valued for their achievements, competence and power, and therefore are not considered old until they are physically unable to work (Carroll, 2016). Consequently, women experience more fear, anxiety, and concern about their identity as they age, and may feel pressure to prove themselves as productive and valuable members of society (Bromberger, Kravitz, & Chang, 2013).
Attitudes about aging, however, do vary by race, culture, and sexual orientation. In some cultures, aging women gain greater social status. For example, as Asian women age they attain greater respect and have greater authority in the household (Fung, 2013). Compared to white women, Black and Latina women possess less stereotypes about aging (Schuler et al., 2008). Lesbians are also more positive about aging and looking older than heterosexual women (Slevin, 2010). The impact of media certainly plays a role in how women view aging by selling anti-aging products and supporting cosmetic surgeries to look younger (Gilleard & Higgs, 2000).
8.3.9 Religion and Spirituality
Grzywacz and Keyes (2004) found that in addition to personal health behaviors, such as regular exercise, healthy weight, and not smoking, social behaviors, including involvement in religious-related activities, have been shown to be positively related to optimal health. However, it is not only those who are involved in a specific religion that benefit, but so too do those identified as being spiritual. According to Greenfield, Vaillant, and Marks (2009) religiosity refers to engaging with a formal religious group’s doctrines, values, traditions, and co-members. In contrast, spirituality refers to an individual’s intrapsychic sense of connection with something transcendent (that which exists apart from and not limited by the material universe) and the subsequent feelings of awe, gratitude, compassion, and forgiveness. Research has demonstrated a strong relationship between spirituality and psychological well-being, irrespective of an individual’s religious participation (Vaillant, 2008). Additionally, Sawatzky, Ratner, & Chiu (2005) found that spirituality was related to a higher quality of life for both individuals and societies.
Based on reports from the 2005 National Survey of Midlife in the United States, Greenfield et al. (2009) found that higher levels of spirituality were associated with lower levels of negative affect and higher levels of positive affect, personal growth, purpose in life, positive relationships with others, self-acceptance, environmental mastery, and autonomy. In contrast, formal religious participation was only associated with higher levels of purpose in life and personal growth among just older adults and lower levels of autonomy. In summary, it appears that formal religious participation and spirituality relate differently to an individual’s overall psychological well-being.
Age: Older individuals identify religion/spirituality as being more important in their lives than those younger (Beit-Hallahmi & Argyle, 1998). This age difference has been explained by several factors including that religion and spirituality assist older individuals in coping with age-related losses, provide opportunities for socialization and social support in later life, and demonstrate a cohort effect in that older individuals were socialized more to be religious and spiritual than those younger (Greenfield et al., 2009).
Gender: In the United States, women report identifying as being more religious and spiritual than men do (de Vaus & McAllister, 1987). According to the Pew Research Center (2016), women in the United States are more likely to say religion is very important in their lives than men (60% vs. 47%). American women also are more likely than American men to say they pray daily (64% vs. 47%) and attend religious services at least once a week (40% vs. 32%). Theories to explain this gender difference include that women may benefit more from the social-relational aspects of religion/spirituality because social relationships more strongly influence women’s mental health. Additionally, women have been socialized to internalize the behaviors linked with religious values, such as cooperation and nurturance, more than males (Greenfield et al., 2009).
Worldwide: To measure the religious beliefs and practices of men and women around the world, the Pew Research Center (2016) conducted surveys of the general population in 84 countries between 2008 and 2015. Overall, an estimated 83% of women worldwide identified with a religion compared with 80% of men. This equaled 97 million more women than men identifying with a religion. There were no countries in which men were more religious than women by 2 percentage points or more. Among Christians, women reported higher rates of weekly church attendance and higher rates of daily prayer. In contrast, Muslim women and Muslim men showed similar levels of religiousness, except frequency of attendance at worship services. Because of religious norms, Muslim men worshiped at a mosque more often than Muslim women. Similarly, Jewish men attended a synagogue more often than Jewish women. In Orthodox Judaism, communal worship services cannot take place unless a minyan, or quorum of at least 10 Jewish men, is present, thus insuring that men will have high rates of attendance. Only in Israel, where roughly 22% of all Jewish adults self-identify as Orthodox, did a higher percentage of men than women report engaging in daily prayer.
8.4 References
AARP. (2009). The divorce experience: A study of divorce at midlife and beyond. Washington, DC: AARP
Ahlborg, T., Misvaer, N., & Möller, A. (2009). Perception of marital quality by parents with small children: A follow-up study when the firstborn is 4 years old. Journal of Family Nursing, 15, 237–263.
Alterovitz, S. S., & Mendelsohn, G. A. (2013). Relationship goals of middle-aged, young-old, and old-old Internet daters: An analysis of online personal ads. Journal of Aging Studies, 27, 159–165. doi.10.1016/j.jaging.2012.12.006
American Association of Community Colleges (2016). Plus 50 community colleges: Ageless learning. Retrieved from http://plus50.aacc.nche.edu/Pages/Default.aspx
American Cancer Society. (2019). Cancer Facts and Figures 2019. Retrieved from https://www.cancer.org/content/dam/cancer-org/research/cancer-facts-and-statistics/annual-cancer-facts-and-figures/2019/cancer-facts-and-figures-2019.pdf
American Diabetes Association (2016). Standards of medical care in diabetes. Diabetes Care. 39(1), 1-112.
American Heart Association (2016). Saturated fats. Retrieved from http://www.heart.org/HEARTORG/HealthyLiving/HealthyEating/Nutrition/Saturated-Fats_UCM_301110_Article.jsp
American Psychological Association (2017). Stress in America: The state of our nation. Retrieved from https://www.apa.org/images/state-nation_tcm7-225609.pdf
American Psychological Association (2016). By the numbers: Hearing loss and mental health. Monitor on Psychology, 47(4), 9.
Anderson, E. R., & Greene, S. M. (2011). “My child and I are a package deal”: Balancing adult and child concerns in repartnering after divorce. Journal of Family Psychology, 25(5), 741-750.
Anderson, E.R., Greene, S.M., Walker, L., Malerba, C.A., Forgatch, M.S., & DeGarmo, D.S. (2004). Ready to take a chance again: Transitions into dating among divorced parents. Journal of Divorce and Remarriage, 40, 61-75.
Aquilino, W. (1991). Predicting parents’ experiences with coresidence adult children. Journal of Family Issues, 12(3), 323-342.
Arai, Y., Sugiura, M., Miura, H., Washio, M., & Kudo, K. (2000). Undue concern for other’s opinions deters caregivers of impaired elderly from using public services in rural Japan. International Journal of Geriatric Psychiatry, 15(10), 961-968.
Armour, S. (2007, August 2). Friendships and work: A good or bad partnership? USA Today. Retrieved from http://usatoday30.usatoday.com/money/workplace/2007-08-01-work-friends_N.htm
Avis, N. E., Stellato, R., & Crawford, S. (2001). Is there a menopausal syndrome? Menopausal status and symptoms across racial/ethnic groups. Social Science and Medicine, 52(3), 345-356.
Baltes, P. B., Staudinger, U. M., & Lindenberger, U. (1999). Lifespan Psychology: Theory and Application to Intellectual Functioning. Annual Review of Psychology, 50, 471-507.
Bargh, J. A., McKenna, K. Y. A, & Fitsimons, G. G. (2002). Can you see the real me? Activation and expression of the true self on the Internet. Journal of Social Issues, 58, 33–48.
Barreto, M., Ryan, M. K., & Schmitt, M. T. (2009). The glass ceiling in the 21st century: Understanding the barriers to gender equality. Washington, DC: American Psychological Association.
Baruch, G., & Brooks-Gunn, J. (1984). Women in midlife. New York: Plenum.
Beach, S. R., Schulz, R., Yee, J. L., & Jackson, S. (2000). Negative and positive health effects of caring for a disabled spouse: Longitudinal findings from the caregiver health effects study. Psychology and Aging, 15(2), 259-271.
Beit-Hallahmi, B., & Argyle, M. (1998). Religious behavior, belief, and experience. New York: Routledge.
Bengtson, V. L. (2001). Families, intergenerational relationships, and kinkeeping in midlife. In N. M. Putney (Author) & M. E. Lachman (Ed.), Handbook of midlife development (pp. 528-579). New York: Wiley.
Berglund, L., Oliver, E. H., Fontanez, N., Holleran, S., Matthews, K., Roheim, P. S., & DELTA Investigators. (1999). HDL-subpopulation patterns in response to reductions in dietary total and saturated fat intakes in healthy subjects. American Journal of Clinical Nutrition, 70, 992-1000.
Berkeley Wellness. (2011). The lowdown on low testosterone. Retrieved from http://www.berkeleywellness.com/self-care/sexual-health/article/lowdown-low-testosterone
Besen, E., Matz-Costa, C., Brown, M., Smyer, M. A., & Pitt-Catsouphers, M. (2013). Job characteristics, core self-evaluations, and job satisfaction. International Journal of Aging & Human Development, 76(4), 269-295.
Billings, A. G., & Moos, R. H. (1981). The role of coping responses and social resources in attenuating the stress of life events. Journal of Behavioral Medicine, 4, 139–157.
Birditt, K. S., & Antonucci, T.C. (2012). Till death do us part: Contexts and implications of marriage, divorce, and remarriage across adulthood. Research in Human Development, 9(2), 103-105.
Borland, D. C. (1982). A cohort analysis approach to the empty-nest syndrome among three ethnic groups of women: A theoretical position. Journal of Marriage and the Family, 44, 117–129.
Borzumato-Gainey, C., Kennedy, A., McCabe, B., & Degges-White, S. (2009). Life satisfaction, self-esteem, and subjective age in women across the life span. Adultspan Journal, 8(1), 29-42.
Bouchard, G. (2013). How do parents reaction when their children leave home: An integrative review. Journal of Adult Development, 21, 69-79.
Bromberger, J. T., Kravitz, H. M., & Chang, Y. (2013). Does risk for anxiety increase during the menopausal transition? Study of Women’s Health Across the Nation (SWAN). Menopause, 20(5), 488-495.
Brown, L. H., & DeRycke, S. B. (2010). The kinkeeping connection: Continuity, crisis and consensus. Journal of Intergenerational Relationships, 8(4), 338-353, DOI: 10.1080/15350770.2010.520616
Brown, S. L., & Lin, I. (2013). The gray divorce revolution: Rising divorce among middle aged and older adults 1990-2010. National Center for Family & Marriage Research Working Paper Series. Bowling Green State University. https://www.bgsu.edu/content/dam/BGSU/college-of-arts-and- sciences/NCFMR/ documents/Lin/The-Gray-Divorce.pdf
Bureau of Labor Statistics. (2019). The employment situation-June 2019. Retrieved from: https://www.bls.gov/news.release/pdf/empsit.pdf
Busse, E. W. (1969). Theories of aging. In E. W. Busse & E/. Pfeiffer (Eds.), Behavior and adaptation in later life (pp. 11-31). Boston, MA: Little Brown.
Carmichael, C. L., Reis, H. T., & Duberstein, P. R. (2015). In your 20s it’s quantity, in your 30s it’s quality: The prognostic value of social activity across 30 years of adulthood. Psychology and Aging, 30(1), 95-105.
Carroll, J. L. (2016). Sexuality now: Embracing diversity (5th ed.). Boston, MA: Cengage Learning.
Carver, C. S., Scheier, M. F., & Weintraub, J. K. (1989). Assessing coping strategies: A theoretically based approach. Journal of Personality and Social Psychology, 56, 267–283.
Center for Sexual Health Promotion. (2010). National survey of sexual health and behavior. Retrieved from http://www.sexualhealth.indiana.edu
Centers for Disease Control (2014a). About high blood pressure. Retrieved from http://www.cdc.gov/bloodpressure/about.htm
Centers for Disease Control and Prevention. (2014b). Behaviors that increase the risk for high blood pressure. Retrieved from http://www.cdc.gov/bloodpressure/behavior.htm
Centers for Disease Control and Prevention. (2014c). Measuring high blood pressure. Retrieved from http://www.cdc.gov/bloodpressure/measure.htm
Centers for Disease Control and Prevention. (2014d). National diabetes statistics report, 2014. Retrieved from http://www.cdc.gov/diabetes/pubs/statsreport14/national-diabetes-report-web.pdf
Centers for Disease Control and Prevention. (2014e). Diagnoses of HIV infection among adults aged 50 years and older in the United States and dependent areas 2010–2014. HIV surveillance report, 21(2), 1-69. Retrieved from http://www.cdc.gov/hiv/pdf/library/reports/surveillance/cdc-hiv-surveillance-supplemental-report-vol-21-2.pdf
Centers for Disease Control and Prevention. (2015). Facts about high cholesterol. Retrieved from http://www.cdc.gov/cholesterol/facts.htm
Centers for Disease Control and Prevention. (2016). The National Center for Health Statistics. Retrieved from https://www.cdc.gov/nchs/index.htm
Centers for Disease Control and Prevention. (2017). National diabetes statistics report, 2017. Retrieved from: https://www.cdc.gov/diabetes/pdfs/data/statistics/national-diabetes-statistics-report.pdf
Chang, Y. F., An, Y., Bigel, M., Wong, D. F., Troncoso, J. C., O’Brien, R. J., Breitner, J. C., Ferruci, L., Resnick, S. M., & Thanbisetty, M. (2016). Midlife adiposity predicts earlier onset of Alzheimer’s dementia, neuropathology and presymptomatic cerebral amyloid accumulation. Molecular Psychiatry, 21(7), 910-915.
Charness, N., & Krampe, R. T. (2006). Aging and expertise. In K. Ericsson, N. Charness & P. Feltovich (Eds.), Cambridge Handbook of expertise and expert performance. Cambridge, United Kingdom: Cambridge University Press.
Cherlin, A. J., & Furstenberg, F. F. (1986). The new American grandparent: A place in the family, a life apart. New York: Basic Books.
Cohen, S., & Wills, T. A. (1985). Stress, social support, and the buffering hypothesis. Psychological Bulletin, 98, 310–357.
Crawford, S. & Channon, S. (2002). Dissociation between performance on abstract tests of executive function and problem solving in real life type situations in normal aging. Aging and Mental Health, 6, 12-21.
Crist, L. A., Champagne, C. M., Corsino, L., Lien, L. F., Zhang, G., & Young, D. R. (2012). Influence of change in aerobic fitness and weight on prevalence of metabolic syndrome. Preventing Chronic Disease 9,110171. doi: http://dx.doi.org/10.5888/pcd9.110171
Crowson, C. S., Matteson, E. L., Myasoedova, E., Michet, C. J., Ernste, F. C., Warrington, K. J., …Gabriel, S. E. (2011). The lifetime risk of adult-onset rheumatoid arthritis and other inflammatory autoimmune rheumatic diseases. Arthritis and Rheumatism, 63(3), 633-639. doi: 10.1002/art.30155.
Csikszentmihalyi, M. (1990). Flow: The psychology of optimal experience. New York: Harper Perennial Modern Classics.
Csikszentmihalyi, M. (1996). Creativity: Flow and the psychology of discovery and invention. New York: Harper Collins.
Dawes, P., DicMonrokinson, C., Emsley, R., Bishop, P. N., Cruickshanks, K. J., Edmundson-Jones, M., …. Munro, K. (2014). Vision impairment and dual sensory problems in middle age. Ophthalmic Physiological Optics, 34, 479–488. doi: 10.1111/opo.12138479
Degges-White, S., & Myers, J, E. (2006). Women at midlife: An exploration of chronological age, subjective age, wellness, and life satisfaction, Adultspan Journal, 5, 67-80.
DeLongis, A., Folkman, S., & Lazarus, R. S. (1988). The impact of daily stress on health and mood: Psychological and social resources as mediators. Journal of Personality and Social Psychology, 54, 486–495.
Dennerstein, L., Dudley, E., & Guthrie, J. (2002). Empty nest or revolving door? A prospective study of women’s quality of life in midlife during the phase of children leaving and re-entering the home. Psychological Medicine, 32, 545–550.
DePaulo, B. (2014). A singles studies perspective on mount marriage. Psychological Inquiry, 25(1), 64-68. doi: 10.1080/1047840X.2014.878173
Desilver, D. (2016). In the U. S. and abroad, more young adults are living with their parents. Retrieved from: https://www.pewresearch.org/fact-tank/2016/05/24/in-the-u-s-and-abroad-more-young-adults-are-living-with-their-parents/
de St. Aubin, E., & Mc Adams, D. P. (1995). The relation of generative concern and generative action to personality traits, satisfaction/happiness with life and ego development. Journal of Adult Development, 2, 99-112.
De Vaus, D. & McAllister, I. (1987). Gender differences in religion: A test of the structural location theory. American Sociological Review, 52, 472-481.
Dew, M. A., Hoch, C. C., Buysse, D. J., Monk, T. H., Begley, A. E., Houck, P. R.,…Reynolds, C. F., III. (2003). Healthy older adults’ sleep predicts all-cause mortality at 4 to 19 years of follow-up. Psychosomatic Medicine, 65(1), 63–73.
Dimah, K., & Dimah, A. (2004). Intimate relationships and sexual attitudes of older African American men and women. The Gerontologist, 44, 612-613.
Drake, B. (2013). Another gender gap: Men spend more time in leisure activities. Pew Research Center. Retrieved from http://www.pewresearch.org/fact-tank/2013/06/10/another-gender-gap-men-spend-more-time-in-leisure-activities/
Dunér, A., & Nordstrom, M. (2007). The roles and functions of the informal support networks of older people who receive formal support: A Swedish qualitative study. Ageing & Society, 27, 67– 85. doi:10.1017/ S0144686X06005344
Easterlin, R. A. (2006). Life cycle happiness and its sources: Intersections of psychology, economics, and demography. Journal of Economic Psychology, 27, 463-482.
Eastley, R., & Wilcock, G. K. (1997). Prevalence and correlates of aggressive behaviors occurring in patients with Alzheimer’s disease. International Journal of Geriatric Psychiatry, 12, 484-487.
Elsesser, L., & Peplau, L. A. (2006). The glass partition: Obstacles to cross-sex friendships at work. Human Relations, 59(8), 1077–1100.
Emslie, C., Hunt, K., & Lyons, A. (2013. The role of alcohol in forging and maintaining friendships amongst Scottish men in midlife. Health Psychology, 32(10, 33-41.
Ericsson, K. A., Feltovich, P. J., & Prietula, M. J. (2006). Studies of expertise from psychological perspectives. In K. Ericsson, N. Charness & P. Feltovich (Eds.), Cambridge Handbook of expertise and expert performance. Cambridge, UK: Cambridge University Press.
Erikson, E. (1950). Childhood and society. New York: Norton & Company.
Erikson, E. (1959). Identity and the life cycle. New York: Norton & Company.
Erikson, E. (1982). The life cycle completed. New York: Norton & Company.
Fehr, B. (2008). Friendship formation. In S. Sprecher, A. Wenzel, & J. Harvey (Eds.), Handbook of Relationship Initiation (pp. 29–54). New York, NY: Psychology Press.
Ferrie, J. E., Shipley, M. J., Cappuccio, F. P., Brunner, E., Miller, M. A., Kumari, M., & Marmot, M. G. (2007). A prospective study of change in sleep duration: Associations with mortality in the Whitehall II cohort. Sleep, 30(12), 1659.
Ford, E. S., Li, C., & Zhao, G. (2010). Prevalence and correlates of metabolic syndrome based on a harmonious definition among adults in the US. Journal of Diabetes, 2(3), 180-193.
Friedman, M., & Rosenman, R. (1959). Association of specific overt behaviour pattern with blood and cardiovascular findings. Journal of the American Medical Association, 169, 1286–1296.
Fry, R. (2017). It’s becoming more common for young adults to live at home-and for longer stretches. Retrieved from:
https://www.pewresearch.org/fact-tank/2017/05/05/its-becoming-more-common-for-young-adults-to-live-at-home-and-for-longer-stretches/ft_17-05-03_livingathome_bygen2/
Füllgrabe, C., Moore, B. C. J., & Stone, M. A. (2015). Age-group differences in speech identification despite matched audio metrically normal hearing: contributions from auditory temporal processing and cognition. Frontiers in Aging Neuroscience, 6, 1-25. doi:10.3389/fnagi.2014.00347
Fung, H. H. (2013). Aging in culture. Gerontologist, 53(3), 369-377.
Gerstel, N., & Gallagher, S. K. (1993). Kinkeeping and distress: Gender, recipients of care, and work–family conflict. Journal of Marriage and the Family, 55, 598–607.
Gibbons, C., Creese, J., Tran, M., Brazil, K., Chambers, L., Weaver, B., & Bedard, M. (2014). The psychological and health consequences of caring for a spouse with dementia: A critical comparison of husbands and wives. Journal of Women & Aging, 26, 3-21.
Gilleard, C., & Higgs, P. (2000). Cultures of aging: Self, citizen and the body. Upper Saddle River, NJ: Prentice Hall Publishers.
Goldscheider, F., & Kaufman, G. (2006). Willingness to stepparent: Attitudes about partners who already have children. Journal of Family Issues, 27, 1415 – 1436.
Goldscheider, F., & Sassler, S. (2006). Creating stepfamilies: Integrating children into the study of union formation. Journal of Marriage and Family, 68, 275 – 291.
Gorchoff, S. M., John, O. P., & Helson, R. (2008). Contextualizing change in marital satisfaction during middle age. Psychological Science, 19, 1194–1200.
Gottman, J. M., & Levenson, R. W. (2000). The timing of divorce: Predicting when a couple will divorce over a 14-year period. Journal of Marriage & the Family, 62, 737-745.
Greene, S. M., Anderson, E. R., Hetherington, E., Forgtch, M. S., & DeGarmo, D. S. (2003). Risk and resilience after divorce. In F. Walsh (Ed.), Normal family processes: Growing diversity and complexity (3rd ed., pp. 96-120). New York: Guilford Press.
Greenfield, E. A., & Marks, N. F. (2006). Linked lives: Adult children’s problems and their parents’ psychological and relational well-being. Journal of Marriage and Family, 68, 442-454.
Greenfield, E. A., Vaillant, G. E., & Marks, N. F. (2009). Do formal religious participation and spiritual perceptions have independent linkages with diverse dimensions of psychological well-being? Journal of Health and Social Behavior, 50, 196-212.
Gripsrud, J. (2007). Television and the European public sphere. European Journal of Communication, 22, 479-492.
Grzywacz, J. G. & Keyes, C. L. (2004). Toward health promotion: Physical and social behaviors in complete health. Journal of Health Behavior, 28(2), 99-111.
Ha, J., Hong, J., Seltzer, M. M., & Greenberg, J. S. (2008). Age and gender differences in the well-being of midlife and aging parents with children with mental health or developmental problems: Report of a national study. Journal of Health and Social Behavior, 49, 301-316.
Harrison, J., Barrow, S., Gask, L., & Creed, F. (1999). Social determinants of GHQ score by postal survey. Journal of Public Health Medicine, 21, 283–288. doi:10.1093/pubmed/21.3.283
Hawkley, L. C., Hughes, M. E., Waite, L. J., Masi, C. M., Thisted, R. A., & Cacioppo, J. T. (2008). From social structural factors to perceptions of relationship quality and loneliness: The Chicago health, aging, and marital status transitions and health outcomes social relations study. The Journals of Gerontology: Series B: Psychological Sciences and Social Sciences, 63, 375–384. doi:10.1093/geronb/ 63.6.S375
Hayslip Jr., B., Henderson, C. E., & Shore, R. J. (2003). The Structure of Grandparental Role Meaning. Journal of Adult Development, 10(1), 1-13.
Hedlund, J., Antonakis, J., & Sternberg, R. J. (2002). Tacit knowledge and practical intelligence: Understanding the lessons of experience. Retrieved from http://www.au.af.mil/au/awc/awcgate/army/ari_tacit_knowledge.pdf
Herman-Stabl, M. A., Stemmler, M., & Petersen, A. C. (1995). Approach and avoidant coping: Implications for adolescent mental health. Journal of Youth and Adolescence, 24, 649–665.
Hetherington, E. M. & Kelly, J. (2002). For better or worse: Divorce reconsidered. New York, NY: Norton.
Holland, K. (2014). Why America’s campuses are going gray. CNBC. Retrieved from http://www.cnbc.com/2014/08/28/why-americas-campuses-are-going-gray.html
Holt-Lunstad, J., Smith, T. B., & Layton, J. B. (2010). Social relationships and mortality risk: a meta-analytic review. PLoS Medicine, 7(7), e1000316.
Hooker, E., & Pressman, S. (2016). The healthy life. NOBA. Retrieved from http://nobaproject.com/modules/the-healthy-life
Horn, J. L., Donaldson, G., & Engstrom, R. (1981). Apprehension, memory, and fluid intelligence decline in adulthood. Research on Aging, 3(1), 33-84.
House, J. S., Landis, K. R., & Umberson, D. (1988). Social relationships and health. Science, 241, 540–545
Hu, G., Qiao, Q., Tuomilehto, J., Balkau, B., Borch, Johnsen, K., & Pyorala, K. (2004). Prevalence of metabolic syndrome and its relation to all-cause and cardiovascular mortality in non-diabetic European men and women. Archives of Internal Medicine, 164(10), 1066-1076.
Huang, J. (2007). Hormones and female sexuality. In M. Tepper & A. F. Owens (Eds.), Sexual Health, Vol 2: Physical Foundations (pp. 43-78). Westport, CT: Praeger.
Humes, L. E., Kewley-Port, D., Fogerty, D., & Kinney, D. (2010). Measures of hearing threshold and temporal processing across the adult lifespan. Hearing Research, 264(1/2), 30-40. doi:10.1016/j.heares.2009.09.010
International Labour Organization. (2011). Global Employment Trends: 2011. Retrieved from http://www.ilo.org/wcmsp5/groups/public/(dgreports?)/(dcomm?)/(publ/documents/publication/wcms_150440.pdf?)
Iribarren, C., Sidney, S., Bild, D. E., Liu, K., Markovitz, J. H., Roseman, J. M., & Matthews, K. (2000). Association of hostility with coronary artery calcification in young adults. Journal of the American Medical Association, 283, 2546–2551.
Jackson, G. R. & Owsley, C. (2000). Scotopic sensitivity during adulthood. Vision Research, 40 (18), 2467-2473. doi:10.1016/S0042-6989(00)00108-5
Jones, J. M. (2013). In U.S., 40% Get Less than Recommended Amount of Sleep. Gallup. Retrieved from http://www.gallup.com/poll/166553/less-recommended- amount sleep.aspx?g_source=sleep%202013&g_medium=search&g_campaign=tiles
Kagawa-Singer, M., Wu, K., & Kawanishi, Y. (2002). Comparison of the menopause and midlife transition between Japanese American and European American women. Medical Anthropology Quarterly, 16(1), 64-91.
Kang, S. W., & Marks, N. F. (2014). Parental caregiving for a child with special needs, marital strain, and physical health: Evidence from National Survey of Midlife in the U.S. 2005. Contemporary Perspectives in Family Research, 8A, 183-209.
Karakelides, H., & Nair, K. S. (2005). Sarcopenia of aging and its metabolic impact. Current Topics in Developmental Biology, 68, 123-148.
Kasper, T. (2015). Why you only need 7 hours of sleep. American Academy of Sleep Medicine. Retrieved from http://sleepeducation.org/news/2015/06/03/why-you-only-need-7-hours-of-sleep
Kaufman, B. E., & Hotchkiss, J. L. 2003. The economics of labor markets (6th ed.). Mason, OH: Thomson South-Western.
Kaufman, S. B., & Gregoire, C. (2016). How to cultivate creativity. Scientific American Mind, 27(1), 62-67.
Kaur, S., Walia, I., & Singh, A. (2004). How menopause affects the lives of women in suburban Chandigarh, India. Climacteric, 7(2), 175-180.
Knowles, M. S., Holton, E. F., & Swanson, R. A. (1998). The adult learner: A neglected species. Houston: Gulf Pub., Book Division.
Kochanek, K. D., Murphy, S. L., Xu, J., & Arias, E. (2019). Deaths: Final data for 2017. National Vital Statistics Reports, 68(9), 1-77.
Kouzis, A. C., & Eaton, W. W. (1998). Absence of social networks, social support, and health services utilization. Psychological Medicine, 28, 1301–1310. doi:10.1017/S0033291798007454
Krause, N. A., Herzog, R., & Baker, E. (1992). Providing support to others and well-being in later life. Journal of Gerontology: Psychological Sciences, 47, P300-311.
Kühnel, J., & Sonnentag, S. (2011). How long do you benefit from vacation? A closer look at the fade-out vacation effects. Journal of Organizational Behavior, 32, 125-143.
Kushida, C. (2005). Sleep deprivation: basic science, physiology, and behavior. London, England: Informal Healthcare.
Lachman, M. E. (2004). Development in midlife. Annual Review of Psychology, 55(1), 305-331. doi: 10.1146/annurev.psych.55.090902.141521
Landsford, J. E., Antonucci, T.C., Akiyama, H., & Takahashi, K. (2005). A quantitative and qualitative approach to social relationships and well-being in the United States and Japan. Journal of Comparative Family Studies, 36, 1-22.
Leach, M. S., & Braithwaite, D. O. (1996). A binding tie: Supportive communication of family kinkeepers. Journal of Applied Communication Research, 24, 200–216.
Lee, B., Lawson, K. M., Chang, P., Neuendorf, C., Dmitrieva, N. O., & Ameida, D. H. (2015). Leisure-time physical activity moderates the longitudinal associations between work-family spillover and physical health. Journal of Leisure Research, 47(4), 444-466.
Levinson, D. J. (1978). The seasons of a man’s life. New York: Knopf.
Livingston, G. (2014). Four in ten couples are saying I do again. In Chapter 3. The differing demographic profiles of first-time marries, remarried and divorced adults. Pew Research Center. Retrieved from http://www.pewsocialtrends.org/2014/11/14/chapter-3-the-differing-demographic-profiles-of-first-time-married-remarried-and-divorced-adults/
Madden, S., St Pierre-Hansen, N., & Kelly L. (2010). First Nations women’s knowledge of menopause: Experiences and perspectives. Canadian Family Physician, 56(9), e331-e337.
Malik, S. (2004). Impact of the metabolic syndrome on mortality from coronary heart disease, cardiovascular disease, and all causes in United States adults. Circulation, 110(10), 1245-1250.
Malone, J. C., Liu, S. R., Vaillant, G. E., Rentz, D. M., & Waldinger, R. J. (2016). Midlife Eriksonian psychosocial development: Setting the stage for late-life cognitive and emotional health. Developmental Psychology, 52(3), 496-508.
Marketing Charts Staff. (2014). Are young people watching less TV? Retrieved from http://www.marketingcharts.com/television/are-young-people-watching-less-tv-24817/
Martin, L. J. (2014). Aging changes in hair and nails. U.S. National Library of Medicine. Retrieved from https://www.nlm.nih.gov/medlineplus/ency/article/004005.htm
Matthews, K. A., Glass, D. C., Rosenman, R. H., & Bortner, R. W. (1977). Competitive drive, pattern A, and coronary heart disease: A further analysis of some data from the Western Collaborative Group Study. Journal of Chronic Diseases, 30, 489–498.
Mayo Clinic. (2014a). Heart disease. Retrieved from http://www.mayoclinic.org/diseases-conditions/heart-disease/basics/definition/con-20034056
Mayo Clinic. (2014b). Metabolism and weight loss: How you burn calories. Retrieved from http://www.mayoclinic.org/healthy-lifestyle/weight-loss/in-depth/metabolism/art-20046508
McKenna, K. A. (2008) MySpace or your place: Relationship initiation and development in the wired and wireless world. In S. Sprecher, A. Wenzel, & J. Harvey (Eds.), Handbook of relationship initiation (pp. 235–247). New York, NY: Psychology Press.
McKenna, K. A., Green, A. S., & Gleason, M. E. J. (2002). Relationship formation on the Internet: What’s the big attraction? Journal of Social Issues, 58, 9–31.
Metlife. (2011). Metlife study of caregiving costs to working caregivers: Double jeopardy for baby boomers caring for their parents. Retrieved from http://www.caregiving.org/wp-content/uploads/2011/06/mmi-caregiving-costs-working-caregivers.pdf
Maillard, P., Sashardi, S., Beiser, A., Himail, J. J., Au, R., Fletcher, E., …. DeCarli, C. (2012). Effects of systolic blood pressure on white-matter integrity in young adults in the Farmington Heart Study: A cross-sectional study. The Lancet: Neurology, 11(12), 1039-1047.
Miller, T. Q., Smith, T. W., Turner, C. W., Guijarro, M. L., & Hallet, A. J. (1996). Meta-analytic review of research on hostility and physical health. Psychological Bulletin, 119, 322–348.
Mitchell, B. A., & Lovegreen, L. D. (2009). The empty nest syndrome in midlife families: A multimethod exploration of parental gender differences and cultural dynamics. Journal of Family Issues, 30, 1651–1670.
Montenegro, X. P. (2003). Lifestyles, dating, and romance: A study of midlife singles. Washington, DC: AARP.
Monthly Labor Review. (2013). Percentage of the non-institutionalized civilian workforce employed by gender & age. Retrieved from http://www.bls.gov/cps/cps_aa2013.htm
Moravec, C. S. (2008). Biofeedback therapy in cardiovascular disease: rationale and research overview. Cleveland Clinic Journal of Medicine, 75, S35–S38.
Morita, Y., Iwamoto, I., Mizuma, W., Kuwahata, T., Matsuo, T., Yoshinaga, M., &Douchi, T. (2006). Precedence of the shift of body-fat distribution over the change in body composition after menopause. Journal of Obstetrics and Gynecology, 32, 513-516.
Morley, J. E., Baumgartner, R. N., Roubenoff, R., Mayer, J., & Nair, K. S. (2001). Sarcopenia. Journal of Laboratory and Clinical Medicine, 137(4), 231-243.
Moskowitz, R. J. (2014). Wrinkles. U. S. National Library of Medicine. Retrieved from https://www.nlm.nih.gov/medlineplus/ency/article/003252.htm
Nakamura, J., & Csikszentmihalyi, M. (2002). The concept of flow. In C. R. Snyder & S. J. Lopez (Eds.), Handbook of positive psychology (pp. 89-105). New York: Oxford University Press.
Nassir, F., Rector, S., Hammoud, G.M., & Ibdah, J.A. (2015). Pathogenesis and prevention of hepatic steatosis. Gastroenterology & Hepatology, 11(3), 167-175.
National Alliance for Caregiving. (2015). Caregiving in the U.S. 2015. Retrieved from http://www.caregiving.org/caregiving2015.
National Eye Institute. (2009). Facts about floaters. Department of Health and Human Services. Retrieved from https://nei.nih.gov/health/floaters/floaters
National Eye Institute. (2013). Facts about dry eye. Department of Health and Human Services. Retrieved from https://nei.nih.gov/health/dryeye/dryeye
National Eye Institute. (2015). Facts about diabetic eye disease. Retrieved from:
https://nei.nih.gov/health/diabetic/retinopathy
National Eye Institute. (2016). Facts about presbyopia. Department of Health and Human Services. Retrieved from https://nei.nih.gov/health/errors/presbyopia
National Institutes of Health. (2007). Menopause: MedlinePlus Medical Encyclopedia. Retrieved from http://www.nlm.nih.gov/medlineplus/ency/article/000894.htm
National Institutes of Health. (2013). Gallstones. U.S. Department of Health and Human Services. Retrieved from http://www.niddk.nih.gov/health-information/health-topics/digestive-diseases/gallstones/Pages/facts.aspx
National Institutes of Health. (2014a). The A1C and diabetes. Retrieved from http://www.niddk.nih.gov/health-information/health-topics/diagnostic-tests/a1c-test-diabetes/Pages/index.aspx
National Institutes of Health (2014b). Age changes in the lungs. Retrieved from https://www.nlm.nih.gov/medlineplus/ency/article/004011.htm
National Institutes of Health (2014c). Sweet stuff: How sugars and sweeteners affect your health. Retrieved from https://newsinhealth.nih.gov/issue/oct2014/feature1
National Institutes of Health. (2014d). What is atherosclerosis? Retrieved from http://www.nhlbi.nih.gov/health/health-topics/topics/atherosclerosis
National Institutes of Health. (2015). Cancer. Retrieved from https://www.cancer.gov/about-cancer/understanding/what-is-cancer
National Institutes of Health. (2016a). Facts about diabetes. Retrieved from http://www.niddk.nih.gov/health-information/health-topics/Diabetes/diabetes-facts/Pages/default.aspx
National Institutes of Health (2016b). Handout on Health: Rheumatoid Arthritis. Retrieved from http://www.niams.nih.gov/health%5Finfo/rheumatic%5Fdisease/
National Institutes of Health. (2016c). Older drivers: How health affects driving. Retrieved from http://nihseniorhealth.gov/olderdrivers/howhealthaffectsdriving/01.html
National Sleep Foundation. (2015). 2015 Sleep in America™ poll finds pain a significant challenge when it comes to Americans’ sleep. National Sleep Foundation. Retrieved from https://sleepfoundation.org/media-center/press-release/2015-sleep-america-poll
National Sleep Foundation. (2016). Menopause and Insomnia. National Sleep Foundation. Retrieved from https://sleepfoundation.org/ask-the-expert/menopause-and-insomnia
Neidleman, M. T., Wambacq, I., Besing, J., Spitzer, J. B., & Koehnke, J. (2015). The Effect of Background Babble on Working Memory in Young and Middle-Aged Adults. Journal of the American Academy of Audiology, 26(3), 220-228. doi:10.3766/jaaa.26.3.3
Neugarten, B. L. (1968). The awareness of middle aging. In B. L. Neugarten (Ed.), Middle age and aging (pp. 93-98). Chicago: University of Chicago Press.
Neugarten, B. L., & Weinstein, K. K. (1964). The changing American grandparent. Journal of Marriage and the Family, 26, 199–204.
Newton, T., Buckley, A., Zurlage, M., Mitchell, C., Shaw, A., & Woodruff-Borden, J. (2008). Lack of a close confidant: Prevalence and correlates in a medically underserved primary care sample. Psychology, Health & Medicine, 13, 185–192. doi:10.1080/ 13548500701405491
Nimrod, G., Kleiber, D. A., & Berdychevesky, L. (2012). Leisure in coping with depression. Journal of Leisure Research, 44(4), 414-449.
Norman, G. (2005). Research in clinical reasoning: Past history and current trends. Medical Education, 39, 418–427. doi:10.1111/j.1365-2929.2005.02127.x
North American Menopause Society. (2016). Menopause FAQs: Understanding the symptoms. Retrieved from Http://www.menopause.org/for-women/expert-answers-to-frequently-asked-questions-about-menopause/menopause-faqs-understanding-the-symptoms
Nwankwo T., Yoon S. S., Burt, V., & Gu, Q. (2013) Hypertension among adults in the US: National Health and Nutrition Examination Survey, 2011-2012. NCHS Data Brief, No. 133. Hyattsville, MD: National Center for Health Statistics, Centers for Disease Control and Prevention, US Dept of Health and Human Services.
Office of Disease Prevention and Health Promotion. (2008). The physical activity guidelines for Americans. Retrieved from http://health.gov/paguidelines/?_ga=1.177233189.1671103883.1467228401
Organisation for Economic Cooperation and Development. (2016). Average annual hours actually worked per worker. OECD Stat. Retrieved from http://stats.oecd.org/Index.aspx?DataSetCode=ANHRS
Palacios, S., Henderson V. W., & Siseles, N. (2010). Age of menopause and impact of climacteric symptoms by geographical region. Climacteric, 13(5), 419-428.
Parker, K. & Patten, E. (2013). The sandwich generation: Rising financial burdens for middle-aged Americans. Pew Research Center. Retrieved from http://www.pewsocialtrends.org/2013/01/30/the-sandwich-generation/
Patel, C., Marmot, M. G., & Terry, D. J. (1981). Controlled trial of biofeedback-aided behavioural methods in reducing mild hypertension. British Medical Journal (Clinical research ed.), 282, 2005–2008.
Pattison, K. (2015). Sleep deficit. Experience Life. Retrieved from https://experiencelife.com/article/sleep-deficit/
Payne, K. K. (2015). The remarriage rate: Geographic variation, 2013. National Center for Family & Marriage Research. Retrieved from http://bgsu.edu/ncfmr/resources/data/family-profiles/payne-remarriage-rate-fp-15-08.html
Peterson, B. E. & Duncan, L. E. (2007). Midlife women’s generativity and authoritarianism: Marriage, motherhood, and 10 years of aging. Psychology and Aging, 22(3), 411-419.
Peterson, B. E., Smirles, K. A., & Wentworth, P. A. (1997). Generativity and authoritarianism: Implications for personality, political involvement, and parenting. Journal of Personality and Social Psychology, 72, 1202-1216.
Pew Research Center. (2010). The return of the multi-generational family household. Retrieved from http://www.pewsocialtrends.org/2010/03/18/the-return-of-the-multi-generational-family-household/
Pew Research Center. (2010a). How the great recession has changed life in America. Retrieved from http://www.pewsocialtrends.org/2010/06/30/how-the-great-recession-has-changed-life-in-america/
Pew Research Center. (2010b). Section 5: Generations and the great recession. Retrieved from http://www.people-press.org/2011/11/03/section-5-generations-and-the-great-recession/
Pew Research Center. (2015). Caring for aging parents. Family support in graying societies. Retrieved from http://www.pewsocialtrends.org/2015/05/21/4-caring-for-aging-parents/
Pew Research Center. (2016). The Gender gap in religion around the world. Retrieved from http://www.pewforum.org/2016/03/22/the-gender-gap-in-religion-around-the-world/
Phillips, M. L. (2011). The mind at midlife. American Psychological Association. Retrieved from http://www.apa.org/monitor/2011/04/mind-midlife.aspx
Proctor, D. N., Balagopal, P., & Nair, K. S. (1998). Age-related sarcopenia in humans is associated with reduced synthetic rates of specific muscle proteins. Journal of Nutrition, 128(2 Suppl.), 351S-355S. 368
Project Time-Off (2016). The state of American vacation: How vacation became a casualty of our work culture. Retrieved from http://www.projecttimeoff.com/research/state-american-vacation-2016
Qian, X., Yarnal, C. M., Almeida, D. M. (2013). Does leisure time as a stress coping source increase affective complexity? Applying the Dynamic Model of Affect (DMA). Journal of Leisure Research, 45(3), 393-414.
Ray, R., Sanes, M., & Schmitt, J. (2013). No-vacation nation revisited. Center for Economic Policy Research. Retrieved from http://cepr.net/publications/reports/no-vacation-nation-2013
Ray, R., & Schmitt, J. (2007). No vacation nation USA – A comparison of leave and holiday in OECD countries. Retrieved from http://www.law.harvard.edu/programs/lwp/papers/No_Holidays.pdf
Research Network on Successful Midlife Development. (2007, February 7). Midlife Research - MIDMAC WebSite. Retrieved from http://midmac.med.harvard.edu/research.html
Riordan, C. M., & Griffeth, R. W. (1995). The opportunity for friendship in the workplace: An underexplored construct. Journal of Business and Psychology, 10, 141–154.
Rossi, A. S. (2004). The menopausal transition and aging process. In How healthy are we: A national study of health in midlife. (pp. 550-575). Chicago: University of Chicago Press.
Rubin, M., Scevak, J., Southgate, E., Macqueen, S., Williams, P., & Douglas, H. (2018). Older women, deeper learning, and greater satisfaction at university: Age and gender predict university students’ learning approach and degree satisfaction. Diversity in Higher Education, 11(1), 82-96.
Saad, L. (2014). The 40 hour work week is actually longer – by 7 hours. Gallop. Retrieved from http://www.gallup.com/poll/175286/hour-workweek-actually-longer-seven-hours.aspx
Salmon, P. (2001). Effects of physical exercise on anxiety, depression, and sensitivity to stress: A unifying theory. Clinical Psychology Review, 21(1), 33–61.
Salthouse, T. A. (2004). What and when of cognitive aging. Current Directions in Psychological Science, 13, 140–144.
Sandgerg-Thoma, S. E., Synder, A. R., & Jang, B. J. (2015). Exiting and returning to the parental home for boomerang kids. Journal of Marriage and Family, 77, 806-818. doi:10.1111/jomf.12183
Sawatzky, R., Ratner, P. A., & Chiu, L. (2005). A meta-analysis of the relationship between spirituality and quality of life. Social Indicators Research, 72, 153-188.
Schaie, K. W. (2005). Developmental influences on adult intelligence the Seattle longitudinal study. Oxford: Oxford University Press.
Scheibe, S., Kunzmann, U. & Baltes, P. B. (2009). New territories of Positive Lifespan Development: Wisdom and Life Longings. In C. R. Snyder & S. J. Lopez (Eds.), Oxford handbook of Positive Psychology (2nd ed.). New York: Oxford University Press.
Schick, V., Herbenick, D., Reece, M., Sanders, S., A., Dodge, B., Middlestadt, S. E., & Fortenberry, J. D. (2010). Sexual behaviors, condom use, and sexual health of Americans over 50: Implications for sexual health promotion for older adults. Journal of Sexual Medicine, 7(Suppl. 5), 315-329.
Schuler, P., Vinci, D., Isosaari, R., Philipp, S., Todorovich, J., Roy, J., & Evans, R. (2008). Body-shape perceptions and body mass index of older African American and European American women. Journal of Cross-Cultural Gerontology, 23(3), 255-264.
Schulz, R., Newsom, J., Mittelmark, M., Burton, L., Hirsch, C., & Jackson, S. (1997). Health effects of caregiving: The caregiver health effects study. Annals of Behavioral Medicine, 19, 110-116.
Seccombe, K., & Warner, R. L. (2004). Marriages and families: Relationships in social context. Belmont, CA: Wadsworth/Thomson Learning.
Seltzer, M. M., Floyd, F., Song, J., Greenberg, J., & Hong, J. (2011). Midlife and aging parents of adults with intellectual and developmental disabilities: Impacts of lifelong parenting. American Association on Intellectual and Developmental Disability, 116, 479-499.
Selye, H. (1946). The general adaptation syndrome and the diseases of adaptation. Journal of Clinical Endocrinology, 6, 117–230.
Shure, J., & Cahan, V. (1998, September 10). Launch an exercise program today, say Aging Institute, Senator John Glenn. National Institute on Aging. Retrieved from http://www.nia.nih.gov/NewsAndEvents/PressReleases/PR19980910Launch.htm
Slevin, K. F. (2010). “If I had lots of money…I’d have a body makeover”: Managing the aging body. Social Forces, 88(3), 1003-1020.
Sorensen, P., & Cooper, N. J. (2010). Reshaping the family man: A grounded theory study of the meaning of grandfatherhood. Journal of Men’s Studies, 18(2), 117-136. doi:10.3149/jms.1802.117
Spiegel, D., Kraemer, H., Bloom, J., & Gottheil, E. (1989). Effect of psychosocial treatment on survival of patients with metastatic breast cancer. The Lancet, 334, 888–891.
Stern, C., & Konno, R. (2009). Physical Leisure activities and their role in preventing dementia: A systematic review. International Journal of Evidence-Based Healthcare, 7, 270-282.
Stewart, S. D., Manning, W. D., & Smock, P. J. (2003). Union formation among men in the US: Does having prior children matter? Journal of Marriage and Family, 65, 90 – 104.
Su, D., Wu, X., Zhang, Y., Li, H., Zhang, J., & Zhou, L. (2012). Depression and social support between China’ rural and urban empty-nest elderly. Archives of Gerontology and Geriatrics, 55, 564–569.
Swierzewski, S. J. (2015). Erectile Dysfunction. Retrieved from http://www.healthcommunities.com/erectile-dysfunction/overview-of-impotence.shtml
Tangri, S., Thomas, V., & Mednick, M. (2003). Prediction of satisfaction among college-educated African American women. Journal of Adult Development, 10, 113-125.
Taylor, B. J., Matthews, K. A., Hasler, B. P., Roecklein, K. A., Kline, C. E., Buysse, D. J., Kravitz, H. M., Tiani, A. G., Harlow, S. D., & Hall, M. H. (2016). Bedtime variability and metabolic health in midlife women: the SWAN Sleep Study. SLEEP, 39(2), 457–465.
Taylor, S. E., Klein, L. C., Lewis, B. P., Gruenewald, T. L., Gurung, R. A., & Updegraff, J. A. (2000). Biobehavioral responses to stress in females: Tend-and-befriend, not fight-or-flight. Psychological Review, 107, 411–429.
Teachman, J. (2008). Complex life course patterns and the risk of divorce in second marriages. Journal of Marriage and Family, 70, 294 – 305.
Teuscher, U., & Teuscher, C. (2006). Reconsidering the double standard of aging: Effects of gender and sexual orientation on facial attractiveness ratings. Personality and Individual Differences, 42(4), 631-639.
Thurston, W. E, & Vissandjée, B. (2005). An ecological model for understanding culture as a determinant of women’s health. Critical Public Health, 15(3), 229-242.
Torti, F. M., Gwyther, L. P., Reed, S. D., Friedman, J. Y., & Schulman, K. A. (2004). A multinational review of recent trends and reports in dementia caregiver burden. Alzheimer Disease and Associated Disorders, 18(2), 99-109.
Tower, R. B., & Kasl, S. V. (1995). Depressive symptoms across older spouses and the moderating effect of marital closeness. Psychology and Aging, 10, 625– 638. doi:10.1037/0882-7974.10.4.625
Twisk, J. W., Snel, J., Kemper, H. C., & van Mechelen, W. (1999). Changes in daily hassles and life events and the relationship with coronary heart disease risk factors: A 2-year longitudinal study in 27–29-year-old males and females. Journal of Psychosomatic Research, 46, 229–240. 370
Uchida, Y., Nakashima, T., Ando, F., Niino, N., & Shimokata, H. (2003). Prevalence of self-perceived auditory problems and their relation to audiometric thresholds in a middle-aged to elderly population. Acta Oto-Laryngologica, 123(5), 618.
Umberson, D., Williams, K., Powers, D., Chen, M., & Campbell, A. (2005). As good as it gets? A life course perspective on marital quality. Social Forces, 81, 493-511.
United Health Foundation. (2016). New report finds significant health concerns loom for seniors in coming years. Retrieved from http://www.unitedhealthfoundation.org/News/Articles/Feeds/2016/052516AHRSeniorReport.aspx?r=3
U.S. Bureau of Labor Statistics (2016). American time use survey – 2015. Retrieved from http://www.bls.gov/news.release/pdf/atus.pdf
U.S. Department of Health and Human Services and U.S. Department of Agriculture. (2015) 2015–2020 Dietary Guidelines for Americans. 8th Edition. Retrieved from http://health.gov/dietaryguidelines/2015/guidelines/
U.S. Department of Labor (2016). Vacation Leave. Retrieved from https://www.dol.gov/general/topic/workhours/vacation_leave
U.S. Government Accountability Office. (2012). Unemployed older workers: Many experience challenges regaining employment and face reduced retirement security. Retrieved from http://www.gao.gov/products/GAO-12-445
Vaillant, G. E. (1977). Adaptation of life. Boston, MA: Little, Brown
Vaillant, G. E. (2008). Spiritual evolution: A scientific defense of faith. New York: Doubleday Broadway.
Vaillant, G. E. (2012). Triumphs of experience. Cambridge, MA: Harvard University Press.
Waldrop, D., Weber, J., Herald, S., Pruett, J., Cooper, K., & Juozapavicius, K. (1999). Wisdom and life experience: How grandfathers mentor their grandchildren. Journal of Aging and Identity, 4 (1), 33-46.
Wang, W. & Parker, K. (2014) Record share of Americans have never married: As values, economics and gender patterns change. Retrieved from http://www.pewsocialtrends.org/2014/09/24/record-share-of-americans-have-never-married/
WebMD. (2016). Erectile Dysfunction: Testosterone Replacement Therapy. Retrieved from http://www.webmd.com/erectile-dysfunction/guide/testosterone-replacement-therapy?page=2#3
Willis, S. L., & Schaie, K. W. (1999). Intellectual functioning in midlife. In S. L. Willis & J. D. Reid (Eds.), Life in the Middle: Psychological and Social Development in Middle Age (pp. 233-247). San Diego: Academic.
Wong, Y. C., & Leung, J. (2012). Long-term care in China: Issues and prospects. Journal of Gerontological Social Work, 55, 570–586.
World Health Organization. (2018). Top 10 causes of death. Retrieved from
https://www.who.int/gho/mortality_burden_disease/causes_death/top_10/en/
World Health Organization. (2019). Burn-out an “occupational phenomenon”: International Classification of Diseases. Retrieved from: https://www.who.int/mental_health/evidence/burn-out/en/
Wu, Z., Sun, L., Sun, Y., Zhang, X., Tao, F., & Cui, G. (2010). Correlation between loneliness and social relationship among empty nest elderly in Anhui rural area, China. Aging and Mental Health, 14, 108–112.
Yeager, C. A., Hyer, L. A., Hobbs, B., & Coyne, A. C., (2010). Alzheimer’s disease and vascular dementia: The complex relationship between diagnosis and caregiver burden. Issues in Mental Health Nursing, 31(6), 376-384.
Yick-Flanagan, A. (2013). Meanings of menopause: Cultural considerations. Retrieved from http://www.netce.com/coursecontent.php?courseid=976
Zuidema, S. U., de Jonghe, J. F., Verhey, F. R., & Koopman, R. T. (2009). Predictors of neuropsychiatric symptoms in nursing home patients: Influence of gender and dementia severity. International Journal of Geriatric Psychiatry, 24(10), 1079-1086.